
Jul 6, 2026
What We Built for the FIFA World Cup 2026
ByPascal Kiefer

From a Live API to a Published Data App in a Few Hours — What We Built for the FIFA World Cup 2026
Every business already has a website. Soon, every business will have a data app — or ten.
That's the core idea behind Embedsy Studio. And to make it real rather than theoretical, we built something live: a fully automated FIFA World Cup 2026 dashboard, updating in real time during every match, with no manual intervention whatsoever.
Real scores. Match timelines. Team lineups. Group standings. All live.
Here's how we built it — and why the same pattern applies far beyond football.
That's the core idea behind Embedsy Studio. And to make it real rather than theoretical, we built something live: a fully automated FIFA World Cup 2026 dashboard, updating in real time during every match, with no manual intervention whatsoever.
Real scores. Match timelines. Team lineups. Group standings. All live.
Here's how we built it — and why the same pattern applies far beyond football.
First: What Is Embedsy Studio?
Embedsy Studio is a new module on top of the Embedsy Portal — the no-code web portal for embedding Power BI reports in your Azure tenant.
Where the Portal gives you full embedding control for Power BI reports, Studio goes further: it lets you build fully custom data apps and websites, combining multiple data sources and visual components in a single drag-and-drop canvas, then publishing or embedding them anywhere.
The building blocks:
Data sources: Power BI semantic models and Microsoft Fabric — with SQL and Databricks in development, and more to follow Components: Power BI visuals, JS libraries (D3, Vega), AI agents, Fabric pipeline triggers, and custom HTML
The workflow is simple:
Connect your data sources (Power BI semantic model or Fabric) Drag & drop components onto a canvas Publish or embed anywhere
Visualization code — for D3, Vega and similar libraries — can be written manually or generated with AI. No front-end development required.
Where the Portal gives you full embedding control for Power BI reports, Studio goes further: it lets you build fully custom data apps and websites, combining multiple data sources and visual components in a single drag-and-drop canvas, then publishing or embedding them anywhere.
The building blocks:
The workflow is simple:
Visualization code — for D3, Vega and similar libraries — can be written manually or generated with AI. No front-end development required.
Watch: Embedsy Studio in 10 Minutes
The fastest way to understand Embedsy Studio is to see it. This 10-minute video shows what Studio is and what building with it looks like — including a first look at the World Cup dashboard featured in this post:
How It Works: From Semantic Model to Published App in 3 Steps
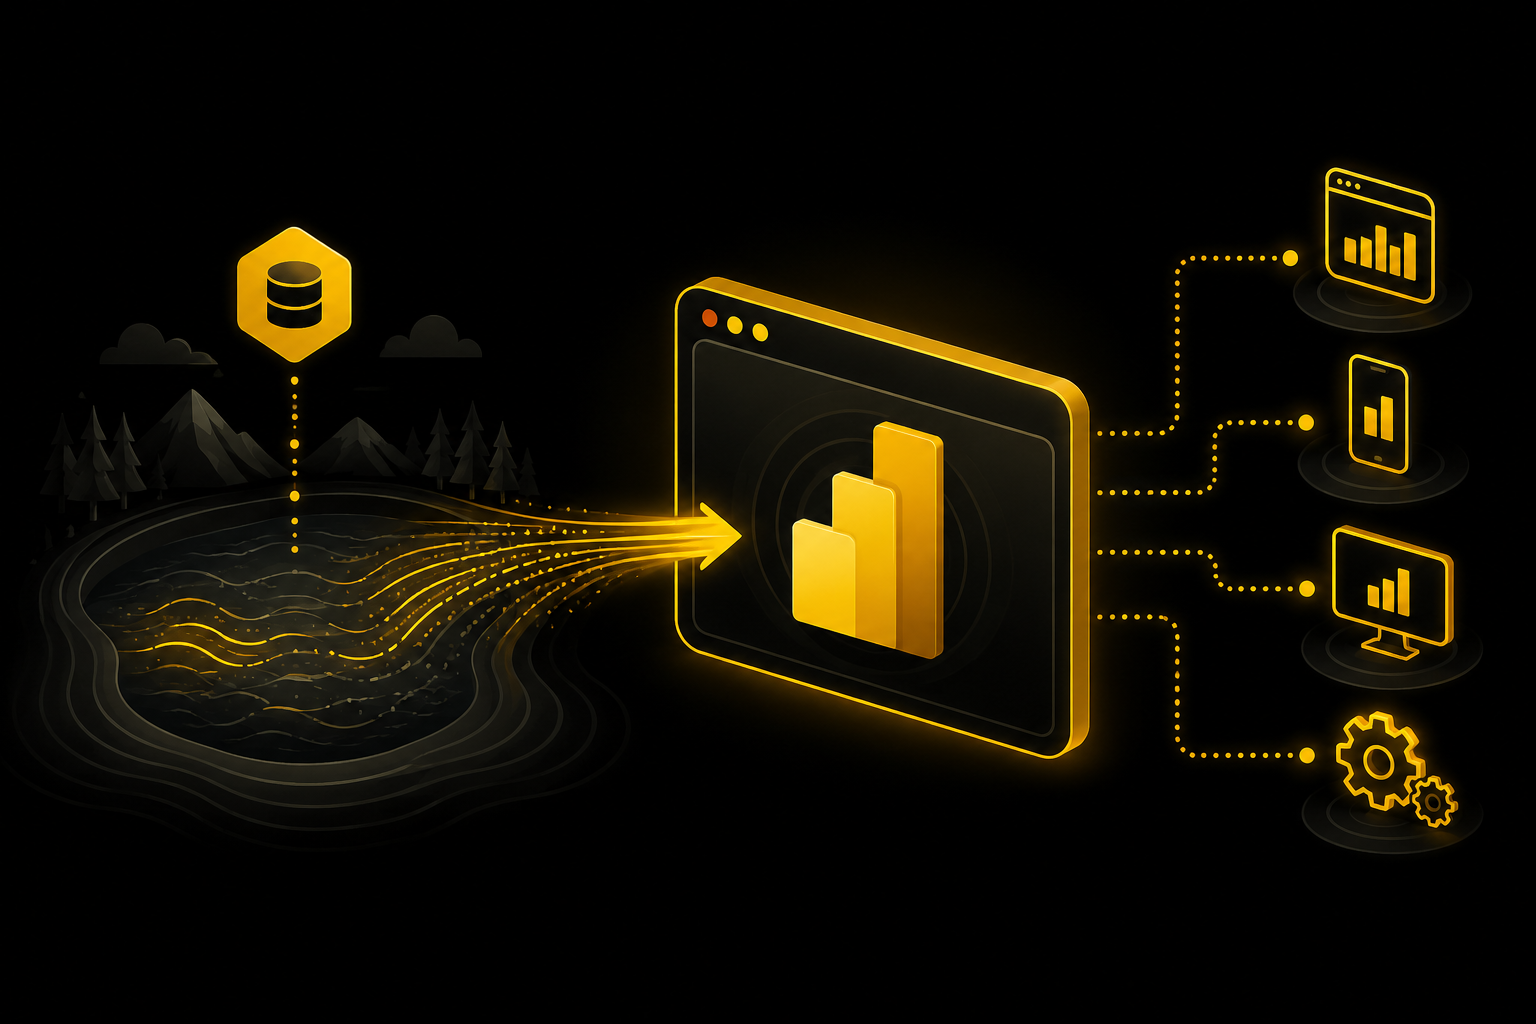
One of the things the World Cup app demonstrates best is how straightforward the data-to-visual pipeline is:
Query your semantic model — write a DAX query (or let the AI write it) to extract exactly the data you need Get back a table — the result is a clean, structured dataset ready to visualize Visualize — map the data to a chart, timeline, map, or any custom visual
That's the core loop. Simple, fast, and powerful enough to produce production-ready apps.
That's the core loop. Simple, fast, and powerful enough to produce production-ready apps.
The Live Demo: FIFA World Cup 2026 Dashboard
We wanted to show Embedsy Studio at its most demanding: real-time streaming data, multiple data types, and a polished public-facing app — all built in a few hours.
The use case: a FIFA World Cup 2026 dashboard showing live scores, match timelines, team lineups, and group standings, updating automatically during every game. No page refreshes. No manual updates.
The use case: a FIFA World Cup 2026 dashboard showing live scores, match timelines, team lineups, and group standings, updating automatically during every game. No page refreshes. No manual updates.
The Technical Pipeline
Step 1 — API-Football
Live match data — scores, lineups, timelines, and standings — pulled from the API-Football data provider during every game.
Step 2 — Fabric Notebook
A Microsoft Fabric notebook polls the API on a schedule, normalises the JSON responses, and writes them into OneLake.
Step 3 — Fabric Eventhouse
The tables land in a Fabric Eventhouse — a KQL database built for real-time data — giving the app low-latency reads against the latest available data.
Step 4 — Embedsy Studio
Visuals were composed in Embedsy Studio with drag and drop. Charts, timelines, and layout components were generated with AI — no hand-written frontend code. Describe what you want, get working visuals.
The Result
A fully live, interactive tournament dashboard — accessible via a public URL, embeddable in any website or platform.
The entire build — pipeline, data model, and visual layer — took a few hours.
👉 See the live app here
The entire build — pipeline, data model, and visual layer — took a few hours.
👉 See the live app here
Why This Matters Beyond Football
The World Cup dashboard is a compelling demo. But the real point is what it proves about the pattern:
If the data is in Fabric, the app can be live within a day.
The same approach applies to:
IoT telemetry — operational dashboards updating as sensors report in Financial feeds — live market data displayed as a polished investor-facing product Operational KPIs — dashboards for location managers showing only their relevant data, not the entire model
If the data is in Fabric, the app can be live within a day.
The same approach applies to:
The Real Opportunity: Beyond Reports
This is where Embedsy Studio changes the conversation.
Every business already asks you to help them clean, understand, and act on their data. You are already doing the hard work. Embedsy Studio makes you the natural choice to also help them surface and distribute that data — to their clients, their partners, their investors, or the world.
Four scenarios we see working in the market right now:
Every business already asks you to help them clean, understand, and act on their data. You are already doing the hard work. Embedsy Studio makes you the natural choice to also help them surface and distribute that data — to their clients, their partners, their investors, or the world.
Four scenarios we see working in the market right now:
🏢 Multi-Location Operations
Spread specific, relevant data to individual location managers — without giving them access to the whole model.
💉 "Injecting" Insights into SaaS Products
Existing SaaS products that need live data and charts without spending months on custom development.
📦 Data-as-a-Product
Build self-contained subscription software where the data is the main value — finance insights, industry reports, benchmarking tools.
🔗 Stakeholder Extranets
Share high-level KPIs and insights with partners, clients, and investors in a branded, secure space.
AI Agents: Natural Language on Your Data
One more Embedsy Studio capability — and the one that consistently generates the most questions: AI agents.
In Embedsy Studio, you can configure an agent in three steps:
Create the agent — define its role, skills, and tone (e.g. "Stock data analyst — explain trends in plain English, compare performance across tickers") Connect it to your semantic model — the agent reads your Power BI data model directly Publish it inside your app — users type a question, they get a plain-English answer backed by real data
No data science background required.
In Embedsy Studio, you can configure an agent in three steps:
No data science background required.
Built for Partners: The Embedsy Ambassador Program
Scenarios like the ones above are exactly what the Embedsy Ambassador Program is built around.
The Ambassador Program is a partnership for BI and Data professionals — consultancies, freelancers, and client-facing analytics teams — who want to deliver embedded analytics and custom data apps to their clients under their own branding and pricing. You identify the opportunity and own the client relationship; Embedsy stays in the background and takes care of the platform — reliability, security, performance, and maintenance.
What ambassadors get:
Guided onboarding and access to a demo environment Embedsy Studio access to build custom data apps for your clients Recurring revenue — via referral or resale, whichever fits your positioning
There's very little required to start: no upfront investment, just a short onboarding.
👉 Learn more on the Ambassador Program page.
The Ambassador Program is a partnership for BI and Data professionals — consultancies, freelancers, and client-facing analytics teams — who want to deliver embedded analytics and custom data apps to their clients under their own branding and pricing. You identify the opportunity and own the client relationship; Embedsy stays in the background and takes care of the platform — reliability, security, performance, and maintenance.
What ambassadors get:
There's very little required to start: no upfront investment, just a short onboarding.
👉 Learn more on the Ambassador Program page.
How to Get Access
Embedsy Studio is currently in preview and activated on request. Partners get access for free and help shape the product roadmap.
👉 Book a free demo — we'll show you what it can do on your data and activate it for your portal.
👉 Book a free demo — we'll show you what it can do on your data and activate it for your portal.
Conclusion
The FIFA World Cup 2026 dashboard wasn't built to show off football stats. It was built to prove a point:
With Embedsy Studio, turning a live data source into a polished, embeddable data app is a matter of hours, not months.
If you're working with Power BI and Microsoft Fabric, you already have everything you need to start building data products for your clients. The only missing piece was the layer that assembles it all together. That's what Studio is.
Want to see what it looks like on your own data? Book a free demo.
With Embedsy Studio, turning a live data source into a polished, embeddable data app is a matter of hours, not months.
If you're working with Power BI and Microsoft Fabric, you already have everything you need to start building data products for your clients. The only missing piece was the layer that assembles it all together. That's what Studio is.
Want to see what it looks like on your own data? Book a free demo.
Related reading

Apr 27, 2026Updated Oct 10, 2026
Power BI Writeback: A Complete Solution Inside the Embedsy Portal

Pascal Kiefer
May 11, 2026
Power BI Embedded with Direct Lake — What You Need to Know
Pascal Kiefer
See also