
Aug 31, 2026
Stop Overpaying for Fabric Capacity: Why Optimisation Beats a Bigger SKU
ByPascal Kiefer
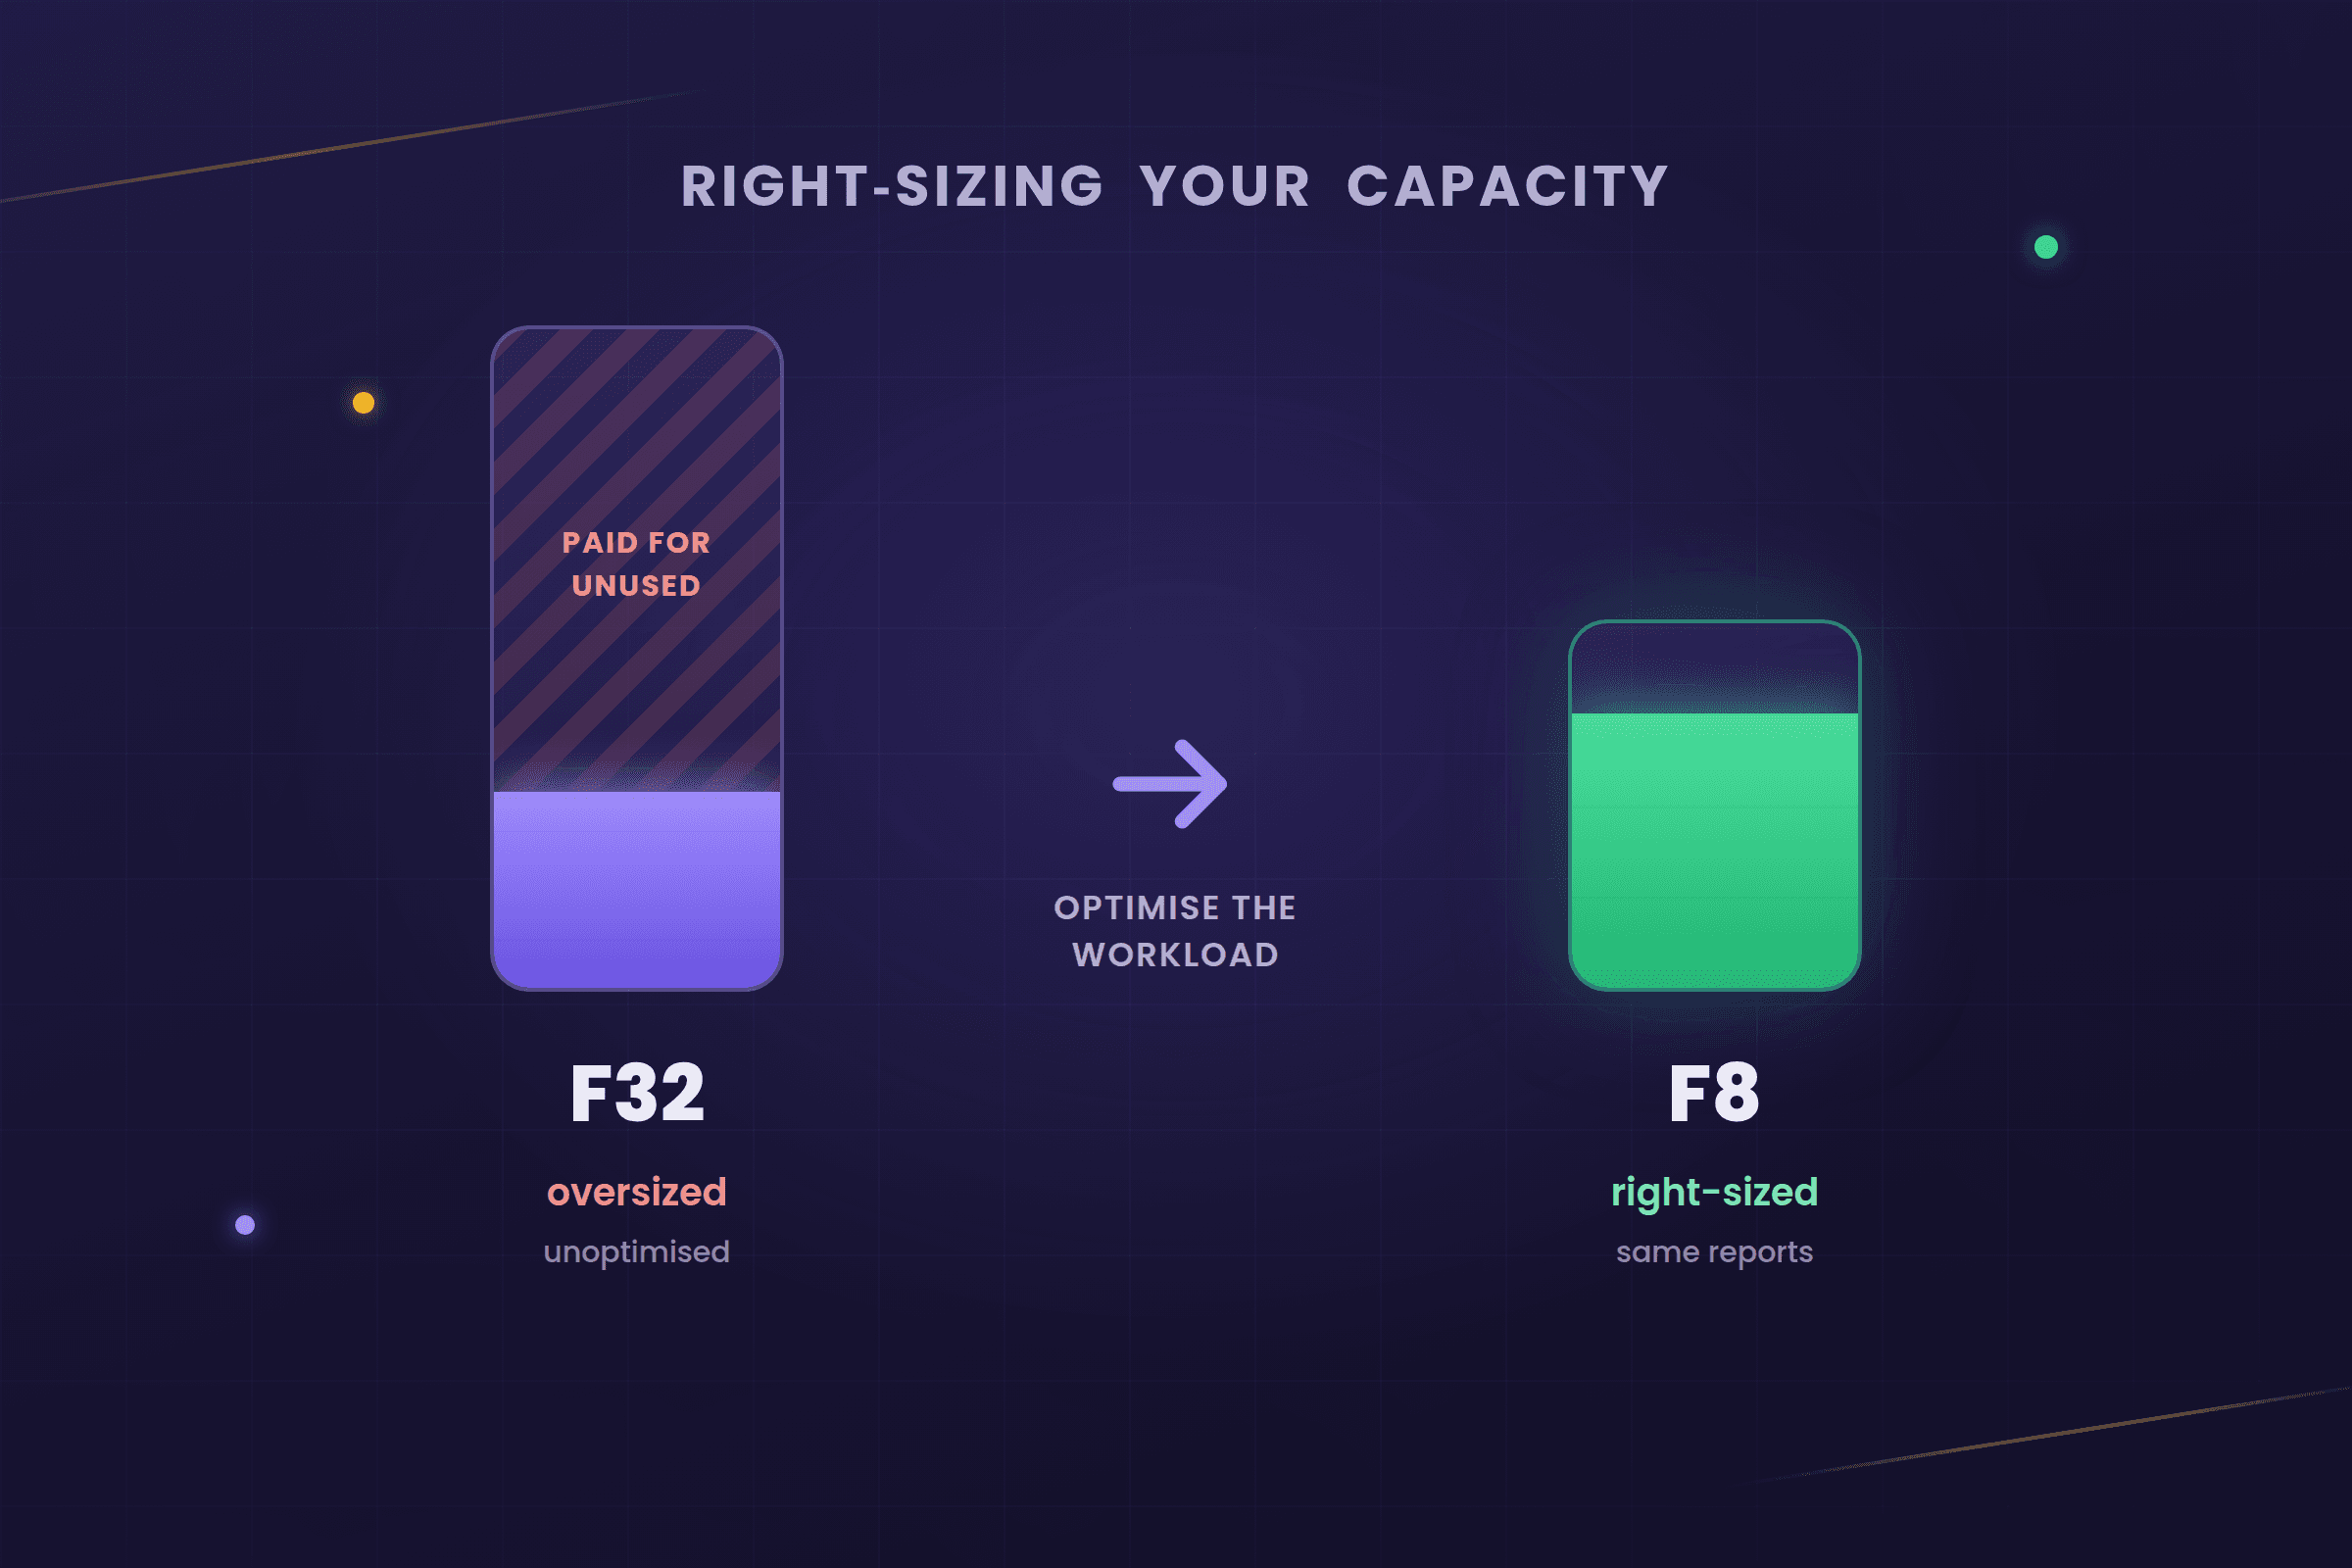
When a capacity is running at or over its limit — reports crawling, refreshes failing, requests being throttled — the quickest fix is to buy a bigger one. It works, and it is often the most expensive way to solve a problem you did not need to have.
The step from one SKU tier to the next is not small. Doubling capacity size roughly doubles the bill, every month, for as long as you run it. Do that once or twice out of caution and the unused headroom can cost more than everything else in your analytics stack combined.
The uncomfortable part: in most cases we look at, the capacity was never the constraint. The work being asked of it was simply inefficient — and a bigger SKU does not fix inefficiency, it just rents enough hardware to absorb it. Here is what actually makes a capacity struggle, how to find out which of those applies to you, and how to size deliberately instead of defensively.
The step from one SKU tier to the next is not small. Doubling capacity size roughly doubles the bill, every month, for as long as you run it. Do that once or twice out of caution and the unused headroom can cost more than everything else in your analytics stack combined.
The uncomfortable part: in most cases we look at, the capacity was never the constraint. The work being asked of it was simply inefficient — and a bigger SKU does not fix inefficiency, it just rents enough hardware to absorb it. Here is what actually makes a capacity struggle, how to find out which of those applies to you, and how to size deliberately instead of defensively.
A bigger SKU is a workaround, not a fix
Scaling up genuinely does clear the symptoms, which is exactly what makes it such a tempting first move. But nothing about the underlying problem changed. The same expensive queries run on every interaction, the same refresh still churns through work it did not need to do — you are now just paying more per month to get through it.
And the bill does not go away. A tier bought in a hurry during a bad week tends to still be there two years later, because nobody wants to be the person who scaled production down. Optimisation is a one-off cost; an oversized capacity is a permanent one.
And the bill does not go away. A tier bought in a hurry during a bad week tends to still be there two years later, because nobody wants to be the person who scaled production down. Optimisation is a one-off cost; an oversized capacity is a permanent one.
What actually makes a Fabric capacity struggle
Capacity pressure rarely traces back to a single cause, and almost never to the one people assume. In practice these are the usual suspects, roughly in the order we find them:
DAX that fights the engine
This is the most common culprit by a distance, and the one least visible from the outside. Power BI answers most queries in its fast, multi-threaded storage engine — but certain patterns force the work back into the single-threaded formula engine instead, where it runs orders of magnitude slower. Iterators over large fact tables, heavy use of context transition, and measures written so the engine cannot fold them down are the usual offenders. The same report, the same data, the same capacity: rewritten measures can turn a sluggish page into an instant one without touching anything else.
A data model that was never really modelled
Models that grew organically — wide flat tables, snowflaked dimensions, bidirectional relationships added to make one visual work, mismatched granularity between fact and dimension — make every query more expensive than it needs to be. A clean star schema is not architectural purity for its own sake; it is the shape the engine is optimised for, and moving towards it often produces a bigger speed-up than any amount of extra capacity.
Refresh cost — though not the way you might think
Refreshes are expensive, but the old advice to stagger them across the night is largely obsolete on Fabric. Fabric smooths the CU cost of background operations over 24 hours, so as Microsoft puts it, scheduled jobs "can all run simultaneously without causing any spikes". What matters is the total consumption, not when it lands — so incremental refresh, refreshing only what changed, and dropping refreshes nobody needs beat rescheduling. Two caveats. Smoothing spreads CU cost, not memory — several large models refreshing at once still need their memory at once. And each SKU has a model refresh parallelism limit: past it, refreshes do not politely wait their turn, they fail with a capacity-limit error.
Columns that earn nothing
High-cardinality columns compress badly — a timestamp carried down to the second, or a transaction ID no report ever references, can occupy more memory than the rest of its table. Columns loaded because they came along with the source query cost memory whether or not anything uses them. This is where model size does matter, and it is worth saying plainly that size alone is a poor predictor: a small model full of bad DAX will comfortably out-struggle a large, well-built one.
Report and page design
A page with twenty visuals fires roughly twenty queries every time someone opens it, and multiplies that by every user and every interaction. Report layout is a capacity decision as much as a design one.
The storage mode you chose
Import is fast to query but holds the model in memory. DirectQuery keeps memory low but pushes load onto the source and struggles under concurrency. Direct Lake targets import-like performance without the memory footprint, but requires a Fabric capacity. Choosing wrongly here is expensive in both directions.
What being at the capacity limit actually looks like
Capacity pressure is not a cliff edge, and knowing which stage you are at tells you how urgent the problem is. Fabric first lets operations burst — briefly using more compute than you bought — then smooths that cost across future 30-second timepoints so short spikes do not cause failures. Only when smoothing can no longer keep up does throttling begin, in stages:
• Up to 10 minutes of borrowed future capacity — overage protection absorbs it, and nobody notices.
• 10 to 60 minutes — interactive delay: every user-triggered operation is held for 20 seconds at submission. This is the stage people describe as "the portal feels sluggish".
• 1 to 24 hours — interactive rejection: user queries are refused outright. Reports stop loading. Background jobs still run.
• Beyond 24 hours — background rejection: everything is refused, refreshes included, until the borrowed capacity is paid back.
This is why the same underlying problem reaches you as three different complaints — slow reports, reports that will not load, failed refreshes. They are not separate faults; they are the same capacity, further down the same ladder.
Microsoft's Surge Protection lets a capacity admin cap what background work is allowed to consume, which stops overnight jobs dragging the capacity into rejection. Worth enabling — but note what it does not cover: an expensive DAX query is an interactive operation, so surge protection will not save you from one. That remains an optimisation problem.
• Up to 10 minutes of borrowed future capacity — overage protection absorbs it, and nobody notices.
• 10 to 60 minutes — interactive delay: every user-triggered operation is held for 20 seconds at submission. This is the stage people describe as "the portal feels sluggish".
• 1 to 24 hours — interactive rejection: user queries are refused outright. Reports stop loading. Background jobs still run.
• Beyond 24 hours — background rejection: everything is refused, refreshes included, until the borrowed capacity is paid back.
This is why the same underlying problem reaches you as three different complaints — slow reports, reports that will not load, failed refreshes. They are not separate faults; they are the same capacity, further down the same ladder.
Microsoft's Surge Protection lets a capacity admin cap what background work is allowed to consume, which stops overnight jobs dragging the capacity into rejection. Worth enabling — but note what it does not cover: an expensive DAX query is an interactive operation, so surge protection will not save you from one. That remains an optimisation problem.
Measure first, then size
Sizing by intuition is how you end up two tiers too high. There is no formula, but there is evidence available before you commit:
• The Fabric Capacity Metrics app shows what your capacity is actually doing — which items consume the most, when the peaks land, and how close you are to throttling. If you run a portal on Embedsy, our capacity monitoring guide covers what to watch.
• Performance Analyzer in Power BI Desktop shows which visuals and which queries are actually slow, and how much of the time is spent in the formula engine rather than the storage engine — which is usually where the DAX problem announces itself.
• DAX Studio and VertiPaq Analyzer break a model down query by query and column by column, so the expensive parts stop being a guess.
• Workspace Monitoring records which queries and refreshes were actually throttled, rather than leaving you to infer it from complaints.
• A realistic load test beats arithmetic. Concurrency rarely behaves the way a spreadsheet predicts.
With those, the sizing conversation changes from "what feels safe?" to "here is what we consume, and here is the headroom we want."
• The Fabric Capacity Metrics app shows what your capacity is actually doing — which items consume the most, when the peaks land, and how close you are to throttling. If you run a portal on Embedsy, our capacity monitoring guide covers what to watch.
• Performance Analyzer in Power BI Desktop shows which visuals and which queries are actually slow, and how much of the time is spent in the formula engine rather than the storage engine — which is usually where the DAX problem announces itself.
• DAX Studio and VertiPaq Analyzer break a model down query by query and column by column, so the expensive parts stop being a guess.
• Workspace Monitoring records which queries and refreshes were actually throttled, rather than leaving you to infer it from complaints.
• A realistic load test beats arithmetic. Concurrency rarely behaves the way a spreadsheet predicts.
With those, the sizing conversation changes from "what feels safe?" to "here is what we consume, and here is the headroom we want."
Then size deliberately
Once you know the shape of your workload:
• Optimise, scale up — or separate. Scaling is not the only alternative to optimising. As James Serra frames it, you can also isolate: move the noisy workloads — ETL, data science, development — onto their own capacity so they cannot starve the one your customers are looking at. For an external-facing portal that is often the more valuable move, because it protects the experience that matters most rather than buying headroom for everything at once.
• Cap the damage a single query can do. Chris Webb has written about lowering the query timeout so one runaway query cannot consume capacity for minutes on end — a cheap guardrail while the underlying DAX gets fixed.
• Start smaller and scale up. Moving up a tier takes minutes. Paying for a tier you never needed takes months to notice.
• Pausing is a lever, not a fix. A dev or test capacity that only runs during the working day costs a fraction of an always-on one, and both A SKUs and Fabric capacities can be paused. But be clear about what it is: like buying a bigger SKU, it lowers the bill without changing what the capacity is being asked to do. It also has real costs. Anything paused is unavailable — which is fine for dev, and often a non-starter for a portal serving external users who may not share your working hours. Resuming leaves you with a cold start while models reload. And it only works reliably if somebody builds and maintains the automation that pauses and resumes it.
• Pausing and reserving cancel each other out. This one catches people: a Fabric capacity reservation is billed for its full term whether the capacity is running or not. Pause a reserved capacity and you save nothing. Pausing only reduces spend on pay-as-you-go.
• Only reserve once you know. Reservation pricing is a substantial discount on pay-as-you-go, but committing to the wrong size for a year is exactly the mistake this article is about — and as above, it takes pausing off the table. Run pay-as-you-go until the numbers are boring, then reserve.
• Embedding changes the licensing question. In an embedded, app-owns-data setup your end users hold no Power BI licences at all — that is the point of the model. Do not let licence-threshold reasoning drive a capacity decision it should not be driving. Our pricing guide covers how the pieces fit, and this post covers which SKU families are still on the table.
• Optimise, scale up — or separate. Scaling is not the only alternative to optimising. As James Serra frames it, you can also isolate: move the noisy workloads — ETL, data science, development — onto their own capacity so they cannot starve the one your customers are looking at. For an external-facing portal that is often the more valuable move, because it protects the experience that matters most rather than buying headroom for everything at once.
• Cap the damage a single query can do. Chris Webb has written about lowering the query timeout so one runaway query cannot consume capacity for minutes on end — a cheap guardrail while the underlying DAX gets fixed.
• Start smaller and scale up. Moving up a tier takes minutes. Paying for a tier you never needed takes months to notice.
• Pausing is a lever, not a fix. A dev or test capacity that only runs during the working day costs a fraction of an always-on one, and both A SKUs and Fabric capacities can be paused. But be clear about what it is: like buying a bigger SKU, it lowers the bill without changing what the capacity is being asked to do. It also has real costs. Anything paused is unavailable — which is fine for dev, and often a non-starter for a portal serving external users who may not share your working hours. Resuming leaves you with a cold start while models reload. And it only works reliably if somebody builds and maintains the automation that pauses and resumes it.
• Pausing and reserving cancel each other out. This one catches people: a Fabric capacity reservation is billed for its full term whether the capacity is running or not. Pause a reserved capacity and you save nothing. Pausing only reduces spend on pay-as-you-go.
• Only reserve once you know. Reservation pricing is a substantial discount on pay-as-you-go, but committing to the wrong size for a year is exactly the mistake this article is about — and as above, it takes pausing off the table. Run pay-as-you-go until the numbers are boring, then reserve.
• Embedding changes the licensing question. In an embedded, app-owns-data setup your end users hold no Power BI licences at all — that is the point of the model. Do not let licence-threshold reasoning drive a capacity decision it should not be driving. Our pricing guide covers how the pieces fit, and this post covers which SKU families are still on the table.
Where we come in
Our position, stated openly: we do not sell you capacity. The Embedsy Portal deploys into your own Azure subscription, so your capacity bill goes to Microsoft, not to us. We earn nothing from you buying a bigger SKU — which means when we tell you that you could run on a smaller one, there is nothing in it for us beyond a customer happier with their total cost.
Capacity optimisation is consulting work we do directly. In practice: reading your capacity metrics rather than guessing, profiling the queries and measures that actually cost you, reworking data model design, refresh strategy and storage mode where it pays, and giving you a sizing recommendation with the reasoning attached rather than a number pulled out of the air.
It starts with a conversation rather than a promise. Every environment is different — some have a large capacity and a long list of problems, some have no capacity yet and a decision to make — so we would rather spend half an hour understanding yours than quote a number into the dark. If there is work worth doing we scope and quote it; if the answer is a quick win your own team can handle, or that your setup is already fine, we will say that instead.
Capacity optimisation is consulting work we do directly. In practice: reading your capacity metrics rather than guessing, profiling the queries and measures that actually cost you, reworking data model design, refresh strategy and storage mode where it pays, and giving you a sizing recommendation with the reasoning attached rather than a number pulled out of the air.
It starts with a conversation rather than a promise. Every environment is different — some have a large capacity and a long list of problems, some have no capacity yet and a decision to make — so we would rather spend half an hour understanding yours than quote a number into the dark. If there is work worth doing we scope and quote it; if the answer is a quick win your own team can handle, or that your setup is already fine, we will say that instead.
Related reading

Aug 7, 2025
Maximizing Performance, Minimizing Costs: Power BI Embedded & Fabric Optimization Strategies

Pascal Kiefer
Aug 30, 2026
Are Power BI Embedded A SKUs Being Retired? What Actually Changed (and What Didn't)
Pascal Kiefer
May 11, 2026
Power BI Embedded with Direct Lake — What You Need to Know
Pascal Kiefer
See also