


Capacity Usage: when your capacity ran, and why
A pay-as-you-go Fabric or Power BI Embedded capacity is billed for the hours it runs. Capacity Usage shows those hours: when the capacity ran, every start and pause with its reason, and who or what caused it. Use it to see whether the capacity settings do what you expect, and what keeps the capacity running.
Admins and super admins open it from the user menu at the bottom of the portal navigation: Capacity Usage.
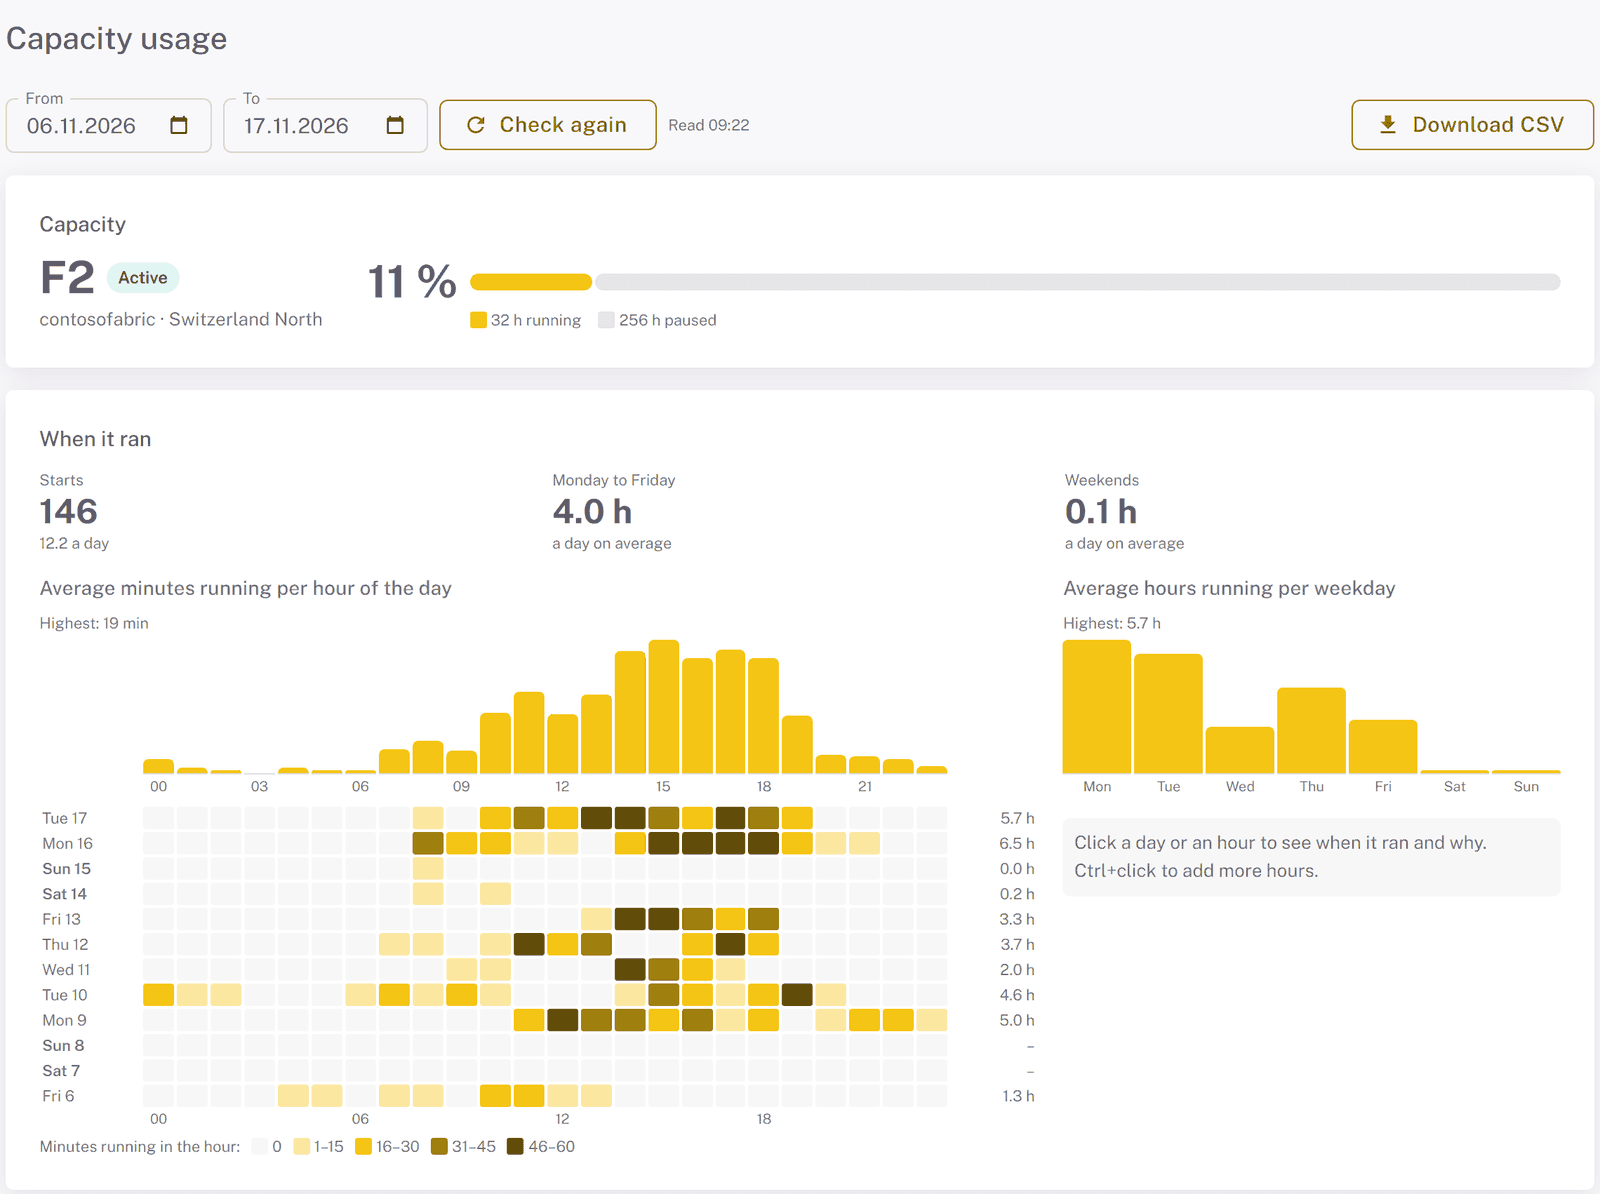
Choose the dates
From and To apply to everything on the page. They go back up to 90 days, which is as long as Azure keeps the capacity's activity log. The page shows times in your own time zone, while the capacity schedule in Global Settings uses UTC. What the page reads is kept for 15 minutes; Check again reads it anew.
The Capacity card shows the capacity's size, whether it runs now, its name and region, and how much of the chosen time it ran, in hours running and paused.
When it ran
The grid has a row per day and a cell per hour; the darker the cell, the more minutes the capacity ran in that hour. Above it, the average minutes it ran per hour of the day; beside it, the average hours per weekday. The figures at the top count the starts and give the average running hours a day, Monday to Friday and on weekends.
Filter the page by hour or weekday
Click a bar of either chart to show only that hour of the day or that weekday on the whole page. Ctrl+click (Cmd+click on a Mac) adds more. The filter shows under the dates, for example Only Mon · 09:00–11:00; clear it there.
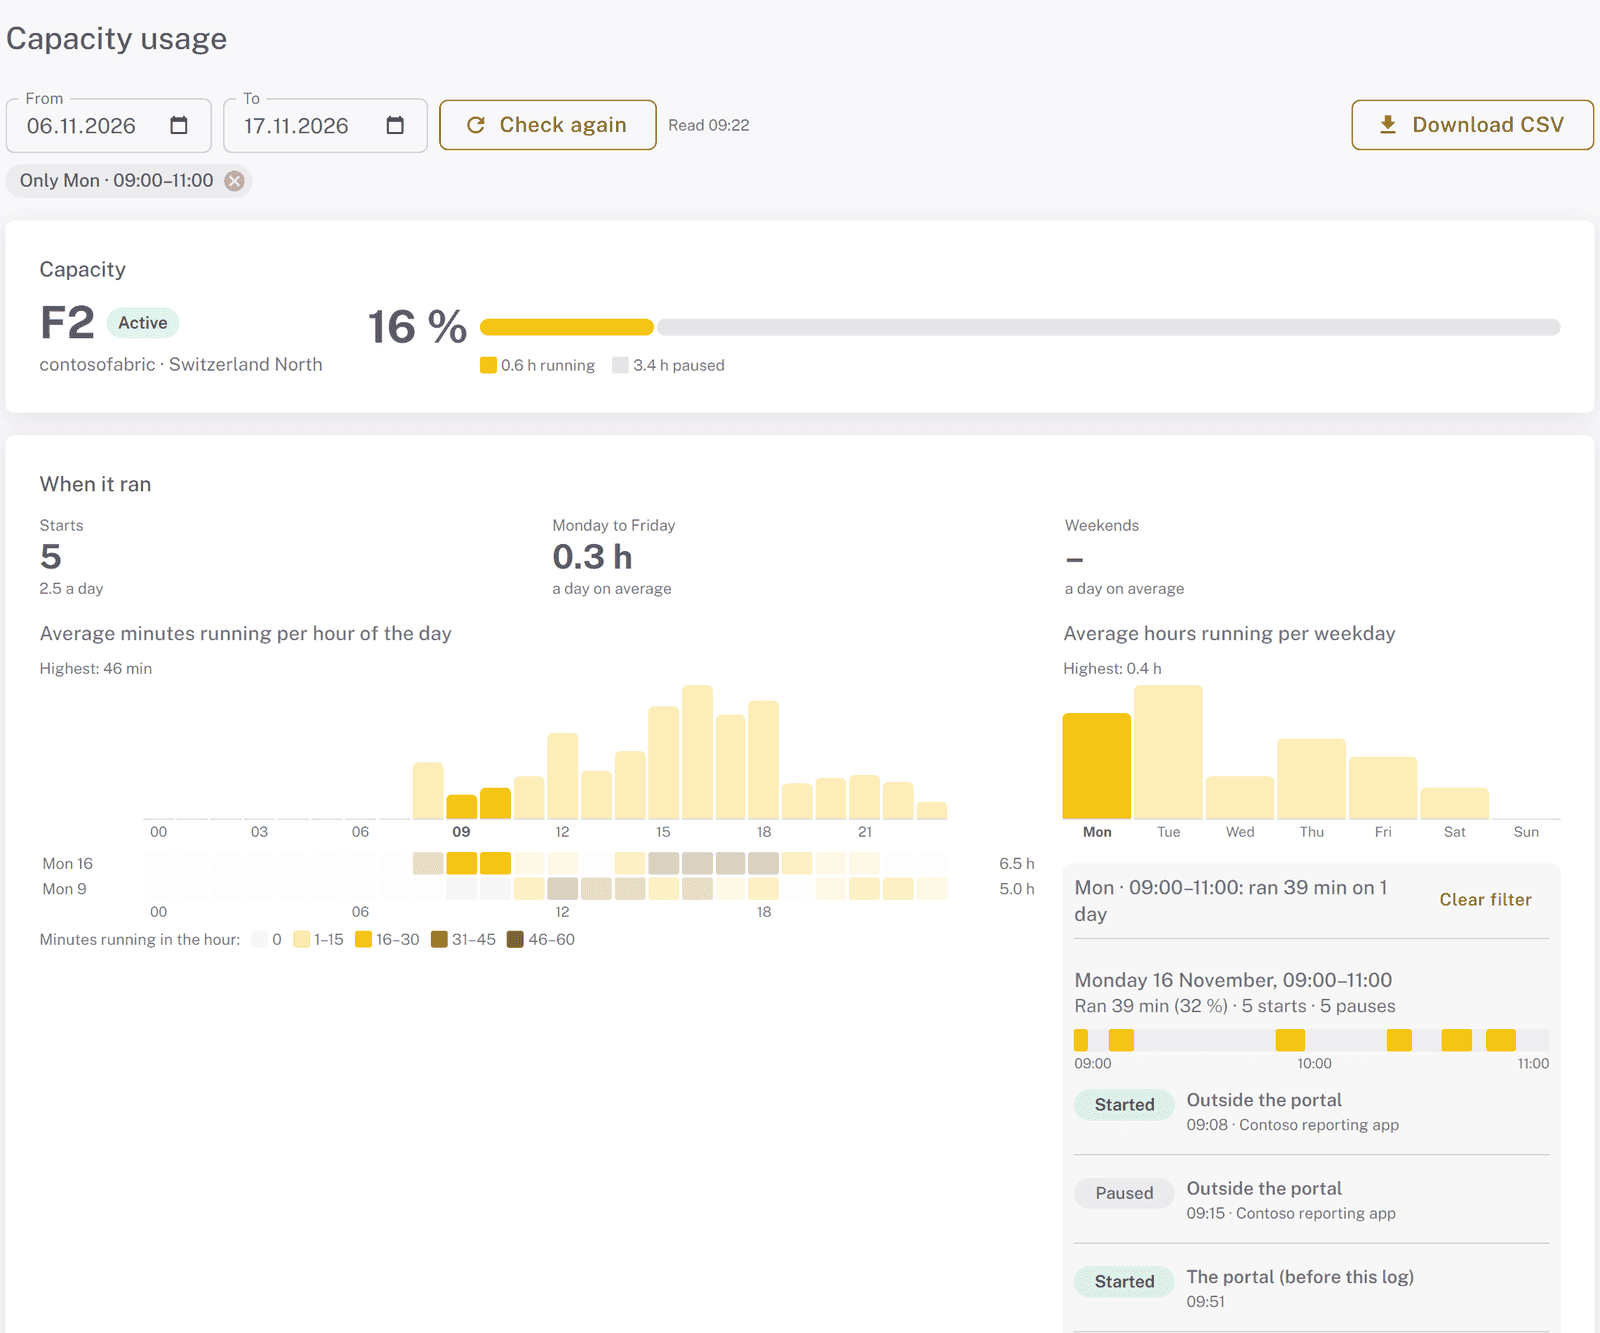
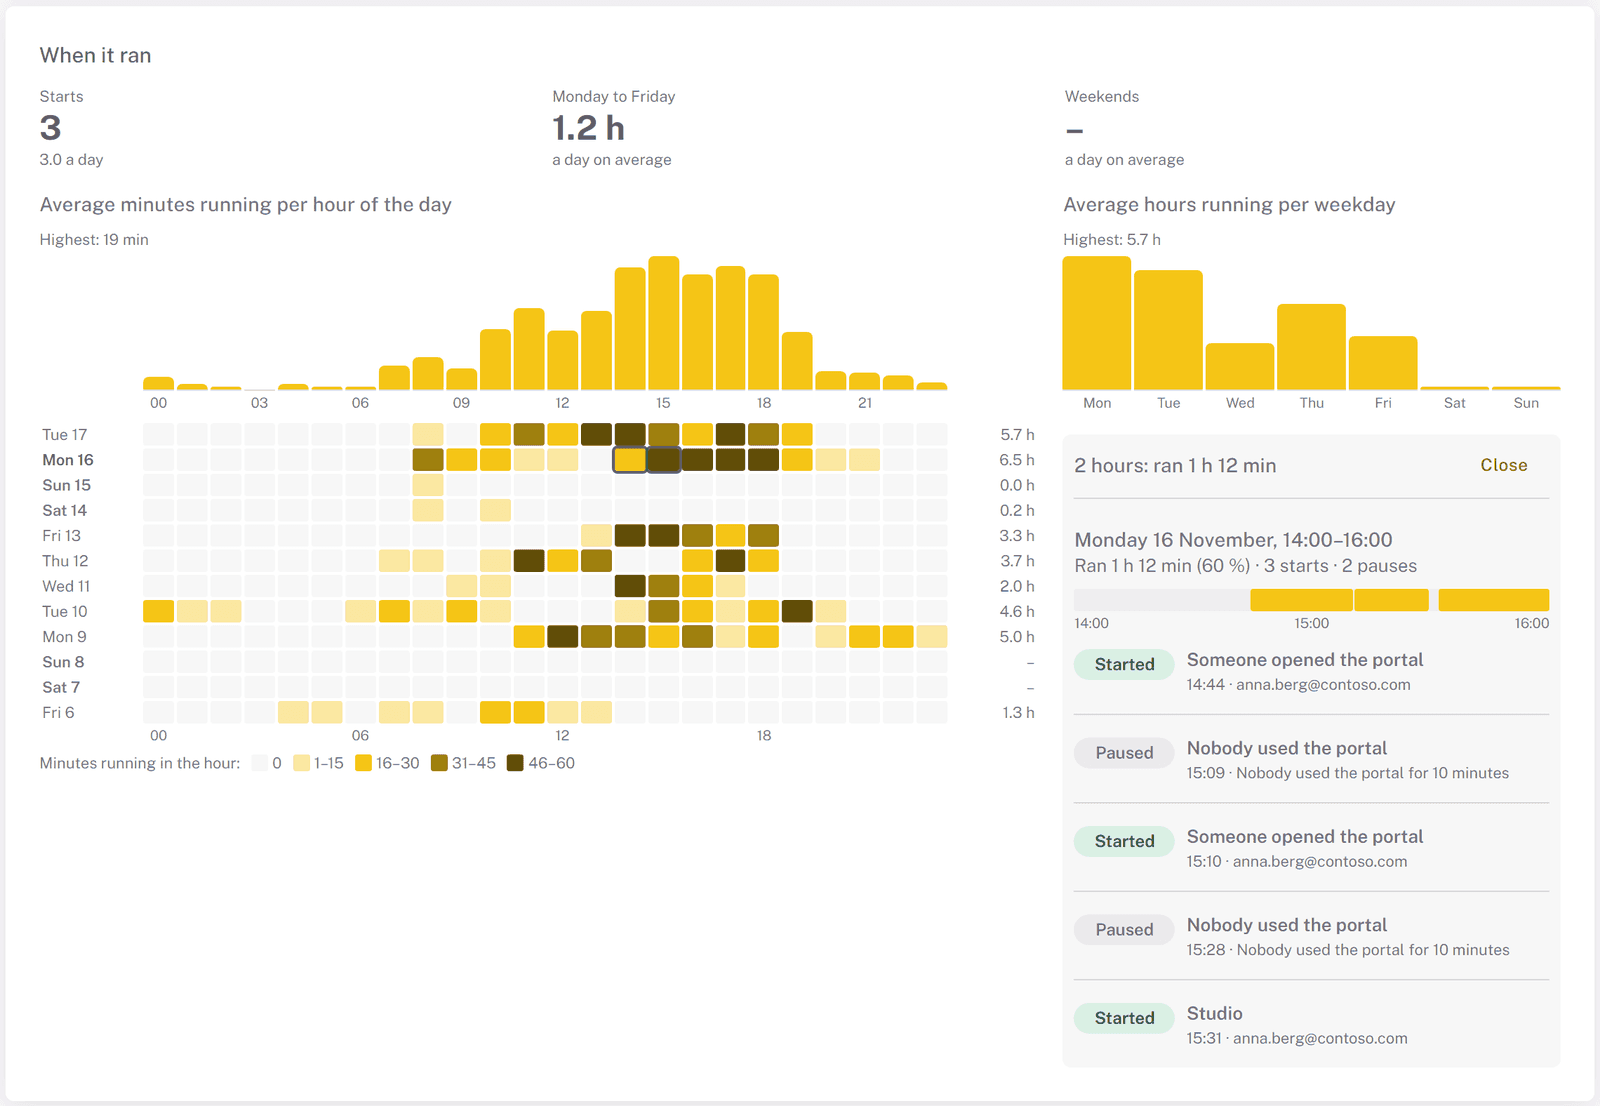
Look at a day or an hour
Click a day's label to see that day on its own: a timeline, how long the capacity ran, and its starts and pauses with their reasons. Click a cell to see one hour; Ctrl+click adds more hours, also on other days. What you pick filters the rest of the page too, including the starts and pauses below.
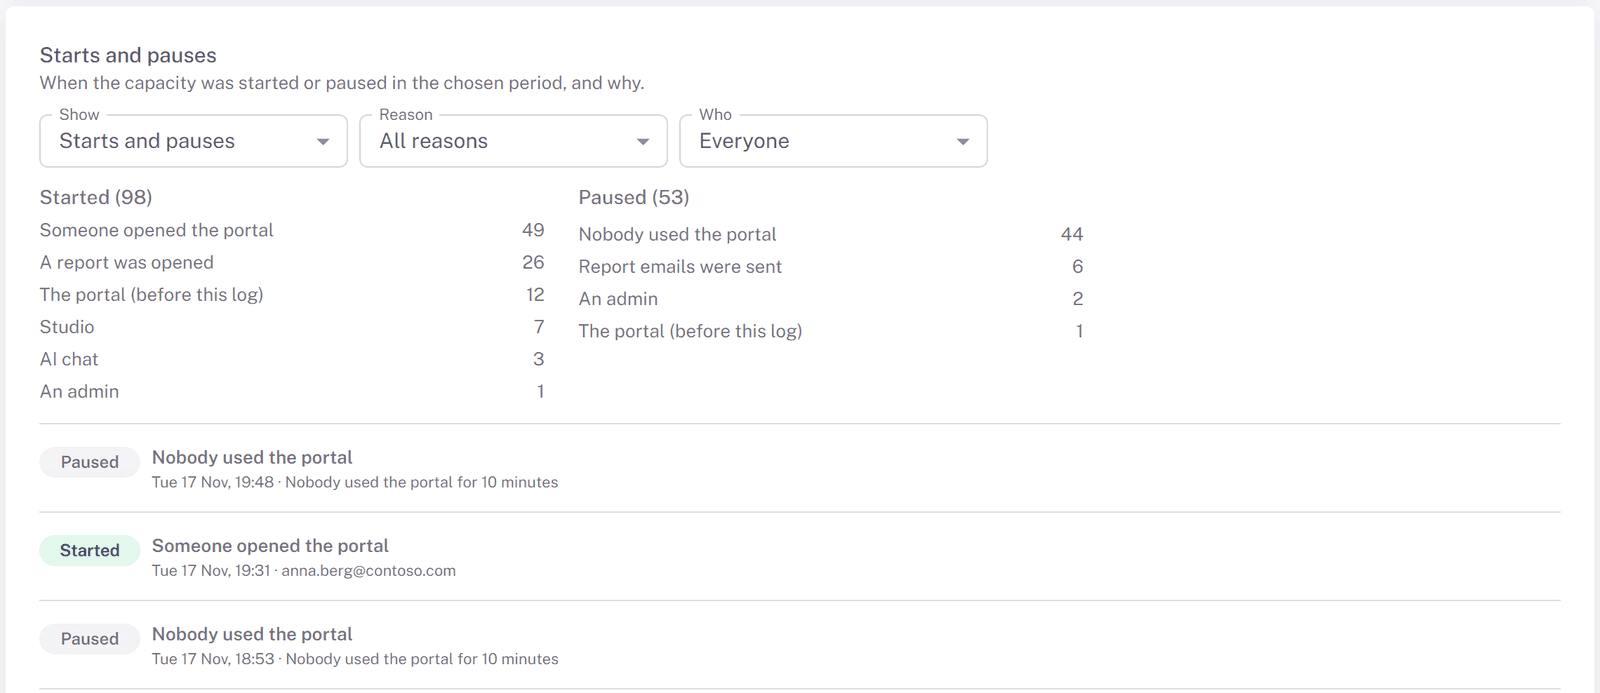
Starts and pauses
Every time the capacity was started or paused, newest first. The summary above the list counts them per reason, so you see at a glance what keeps the capacity running. Narrow the list with Show (starts, pauses or failures), Reason and Who, or click a reason in the summary.
| Reason | What happened |
|---|---|
| Schedule started / Schedule ended | A Scheduled Capacity window began or ended. |
| Inside the schedule | The capacity was paused during a scheduled window and was started again. |
| Nobody used the portal | Paused after the inactivity time set in Global Settings. |
| Report emails were sent | Paused right after the scheduled report emails it was started for. |
| Someone opened the portal / A report was opened | Started when someone signed in or opened a report. |
| Studio | Started by a Studio app. The detail names the app. |
| AI chat | Started to answer a question in the AI chat. |
| A report schedule | Started to send a scheduled report email. |
| An admin | Started or paused by an admin in Global Settings. |
| Outside the portal | Started or paused in the Azure portal, by a script or by another app. |
| The portal (before this log) | Started or paused by the portal before it kept its own log. |
Who names the person, This portal for what the portal did on its own, such as the schedule or the inactivity pause, or, for an app outside the portal, the app's name in Microsoft Entra. A start or pause that failed is marked Failed, with Azure's answer.
Download CSV saves the starts and pauses of the chosen dates and filters, with times in UTC.
What it needs
The page reads the capacity and its activity log from Azure with the access the portal already uses to pause and resume the capacity (see Capacity Settings). If the activity log can't be read, the page says so and still shows the starts and pauses the portal recorded itself.
The page shows hours, not cost. Running hours times a list price is not what you pay: a capacity that used more than its size borrows from the coming hours, and pausing it bills that borrowed use at once. To see which reports and refreshes use the capacity, see capacity monitoring.