


Writeback: Tables for Data Entry
Preview feature
This feature is currently in preview. If you don't see it, contact us or your Admin to activate it.
Preview features:
- are provided as-is and aren't meant for production use.
- may have limited or restricted functionality, and details may change before general availability.
- are supported on a best-effort basis and may be subject to reduced or different security, compliance, and privacy commitments.
Power BI reports can only read data. Writeback gives you a place to store data that people enter themselves, such as budgets, targets or comments: you create tables in the Embedsy Portal, share them with the roles that should fill them in, and connect them to your Power BI semantic model so the data shows up in your reports.
The tables are created in the Azure SQL database that was set up with your Embedsy installation, so the data stays in your own Azure environment.
Admins and super admins create and manage the tables. Other users enter data in the tables that are shared with their roles, from the Data Entry section of their navigation.
Turning on Writeback
Writeback is a preview feature. A super admin turns it on in Global Settings: under Preview Features, switch on Writeback and confirm with Activate.

If you turn Writeback off again, nobody can open it anymore and the Data Entry section disappears from the navigation, but your tables and their data stay in the database. They are back as soon as you turn the feature on again.
Opening Writeback
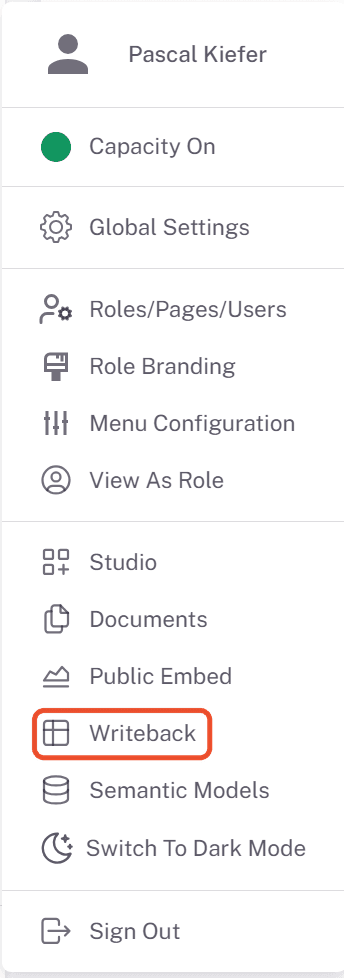
Open Writeback from the user menu at the bottom of the portal navigation:
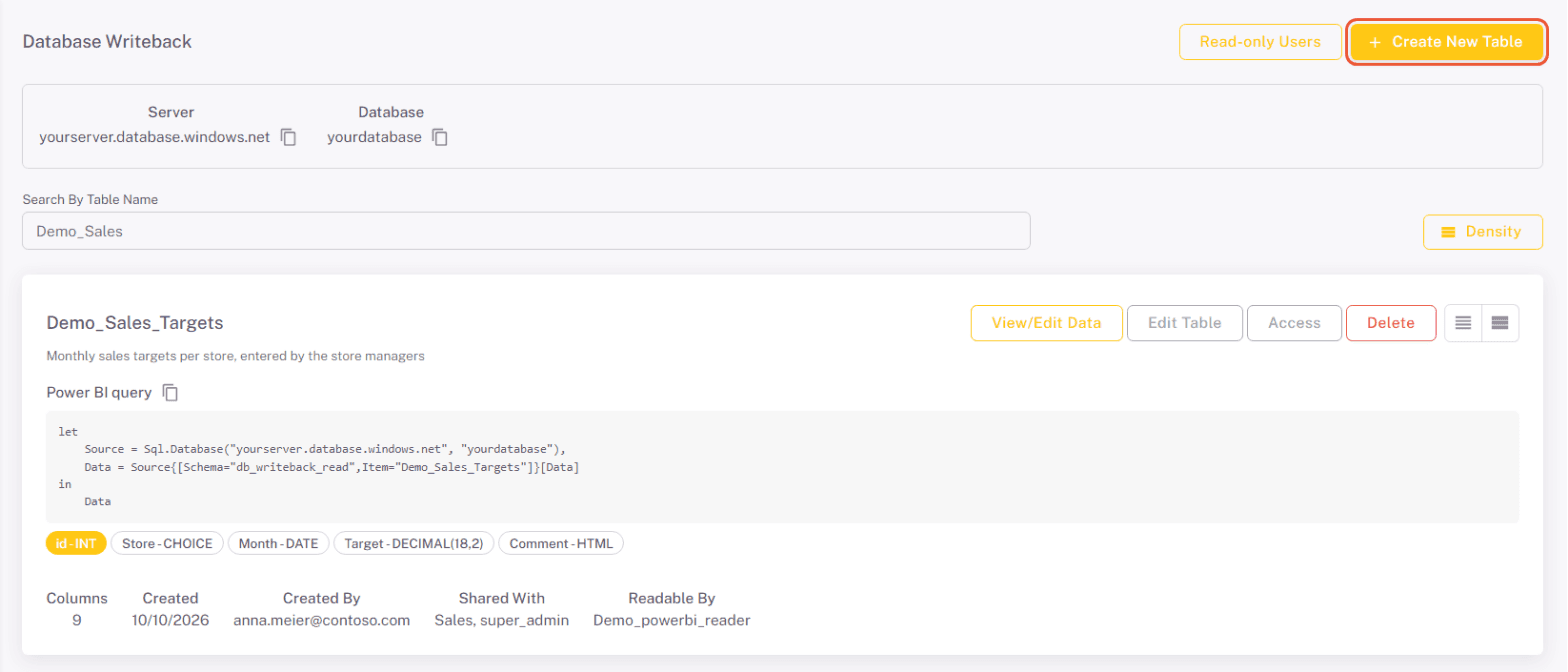
The Database Writeback page lists all writeback tables with their columns, when they were created and by whom, which roles they are shared with and which read-only users can read them. The Server and Database names of your installation are shown at the top, each with a copy button. Use Search By Table Name to find a table, and Density to show the list more compactly.
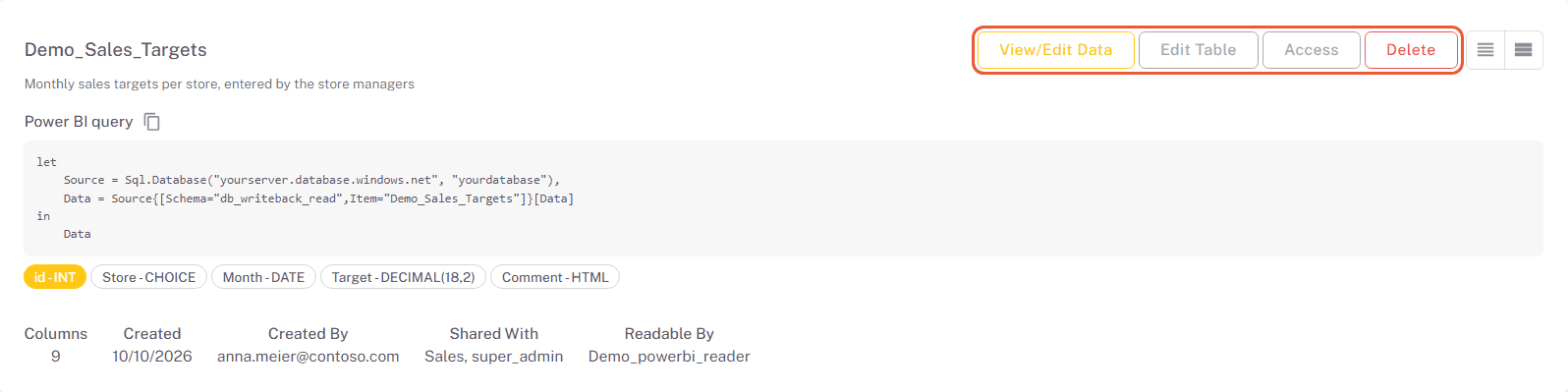
Each table has four buttons: View/Edit Data, Edit Table, Access and Delete.
Creating a table
- Click Create New Table.
- Enter a Table Name. The name can't be changed later. Optionally, add a Description so others know what the table is for.
- Click Add Column for each column you need. The columns are listed in a table that already shows the generated
idcolumn.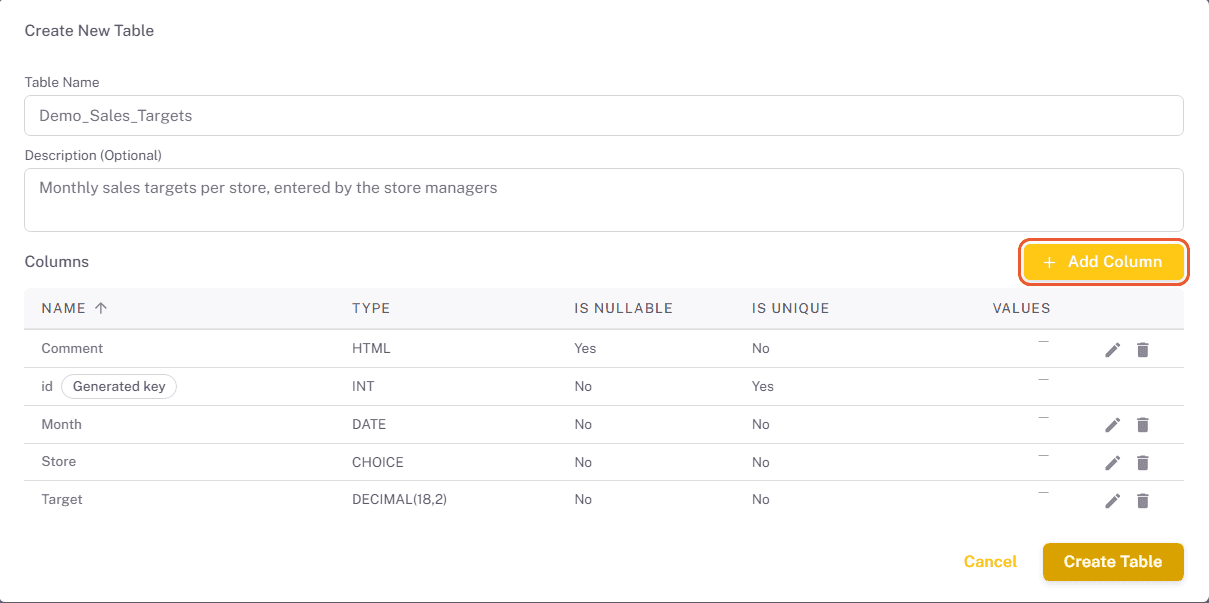
- For each column, enter a Column Name and choose a Data Type, then click Add Column under the form:
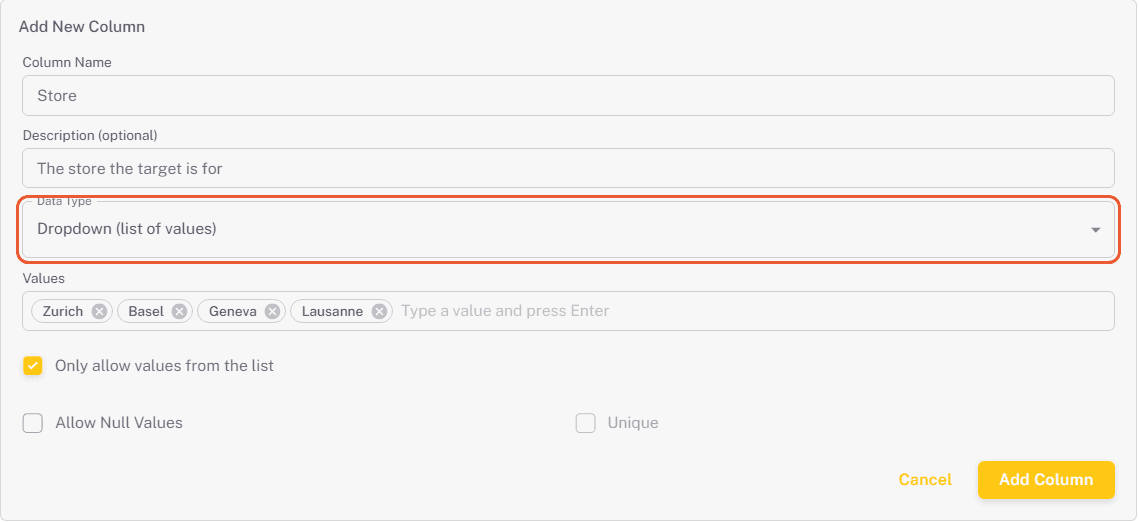
- Add a Description to explain what belongs in the column. People entering data see it when they hover over the column header.
- For text columns, set the maximum length, or choose MAX for long text. For decimal columns, set the Total digits and the Decimal places.
- Uncheck Allow Null Values if the column must always have a value.
- Check Unique if no two rows may have the same value in the column. You can only set this when you add a column.
Until you create the table, you can change or remove a column with the pencil and bin icons next to it.
- Click Create Table.
The portal adds an id to every table and records who added and last edited each row, and when. In Power BI these columns are called id, _created_by, _created_at, _updated_by and _updated_at.
Data types
| Data type | Use it for |
|---|---|
| Integer (INT) | Whole numbers, such as quantities or IDs. |
| Big Integer (BIGINT) | Very large whole numbers. |
| Decimal (DECIMAL) | Exact numbers with decimals, such as amounts. You choose how many digits and decimal places. |
| Float (FLOAT) | Numbers where exact decimals don't matter, such as ratios. |
| Unicode Text (NVARCHAR) | Text in any language. |
| Text (VARCHAR) | Text without special characters. |
| Rich text (HTML) | Formatted text, such as comments with bold text, lists and links. |
| Dropdown (list of values) | A value picked from a fixed list, such as a status or a region. |
| Date (DATE) | A calendar date without a time. |
| Date & Time (DATETIME2) | A date with a time. |
| Boolean (BIT) | Yes/no values. |
Dropdown columns
A dropdown column offers a fixed list of values. Under Values, type each value and press Enter. With Only allow values from the list checked (the default), people can only pick one of these values. Uncheck it to make the list a set of suggestions: people can then type any other text as well.
You can also turn an existing text column into a dropdown: the list starts with the values it already holds.
In the column list, a dropdown column's type is shown as CHOICE and a rich text column's as HTML. In Power BI both arrive as text, and rich text arrives with its HTML formatting tags.
Sharing tables with roles
To let people other than admins work with a table, share it with their roles. Each person then sees the table in the Data Entry section of their navigation, with exactly the rights you gave them.
- Click Access on the table.
- Under Add a role, search for a role and pick it. All portal roles are listed, including imported Entra groups and the admin roles. Add as many roles as you need.
- For each role, choose what its members get under Members get. A newly added role starts with View all rows.
- Optionally, give individual members a different level. The role's members who have signed in at least once are listed under it; each starts at Role default.
- Click Save.
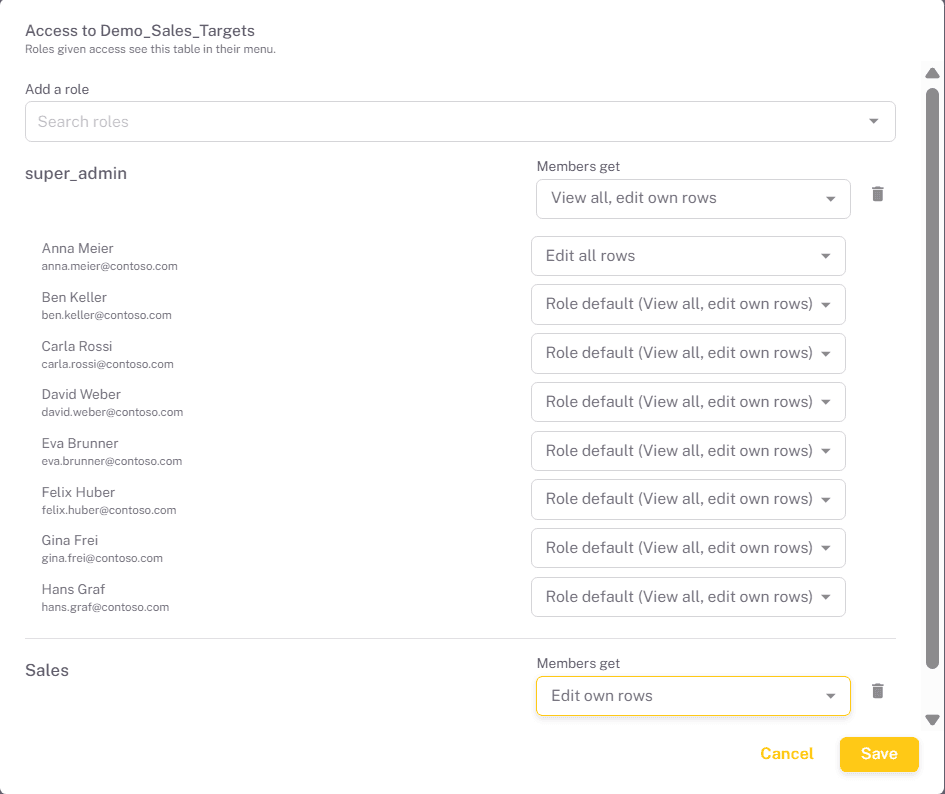
The access levels decide which rows a person sees and which they can change. Their own rows are the rows they added. Editing always includes adding new rows and deleting rows.
| Level | Sees | Can add, edit and delete |
|---|---|---|
| View own rows | Only the rows they added | Nothing |
| View all rows | All rows | Nothing |
| Edit own rows | Only the rows they added | Their own rows |
| View all, edit own rows | All rows | Their own rows |
| Edit all rows | All rows | All rows |
| No access | The table isn't in their menu | Nothing |
How the levels combine:
- Someone in several roles that have access gets the widest view and the widest editing right among them. For example, View all rows from one role and Edit own rows from another give View all, edit own rows.
- A level set for an individual member replaces whatever their roles would give them, higher or lower.
- Setting a role to No access lets in only the members you give a level of their own.
- Access follows the roles a person holds right now. Someone who leaves the role loses access to the table, even with a level of their own.
Removing a role from the dialog takes the table away from its members when you save.
The Data Entry menu
Tables shared with a person appear in their navigation under Data Entry, one entry per table. Clicking a table opens it in the same data grid admins use (see Viewing and entering data). A short note above the grid tells people what they can do, for example that they can only edit the rows they added.
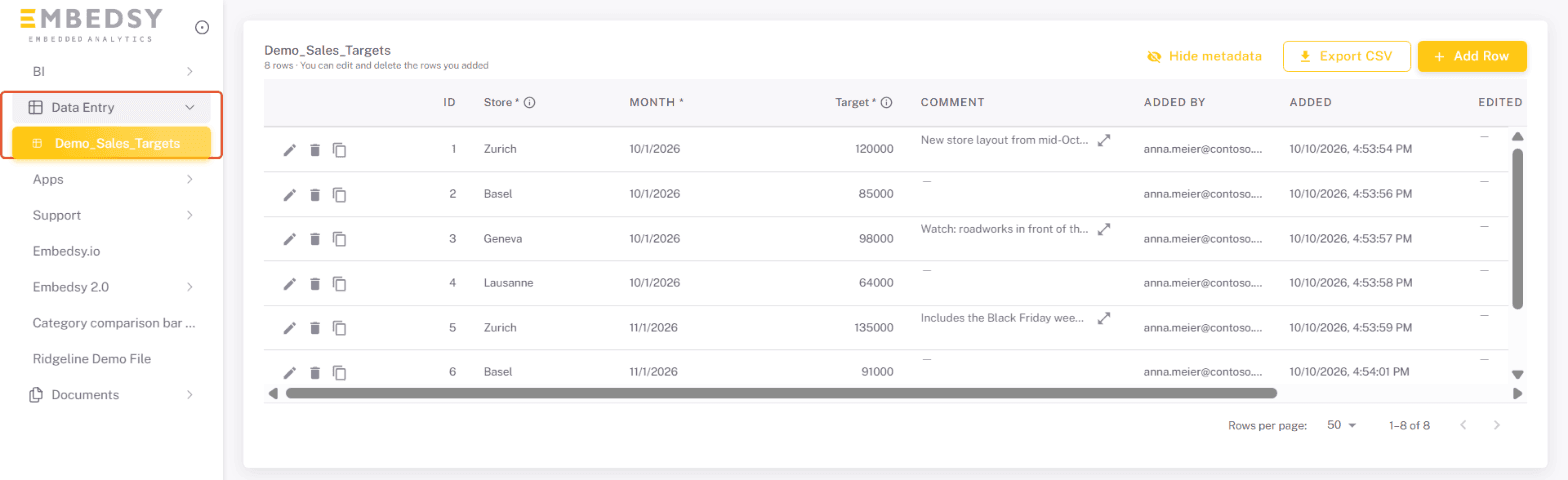
Admins see in their own Data Entry section only the tables shared with their own roles. They manage every table on the Writeback page.
You decide where Data Entry appears in each role's menu in Menu Configuration. When you use View As on a role, you see that role's tables at the level the role gives its members, so you see the same buttons they do. Levels set for individual members aren't included.
Viewing and entering data
Admins open a table's data with View/Edit Data and can change every row. Other users open the table from the Data Entry menu and get the buttons their level allows.
To add a row:
- Click Add Row. A new row opens at the top of the grid.
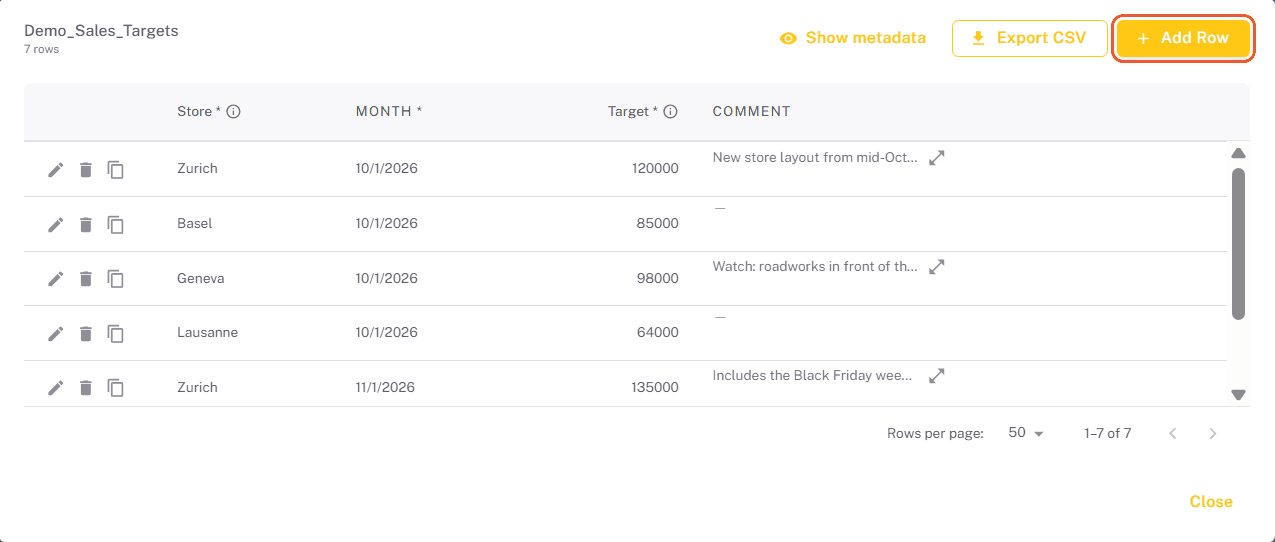
- Fill in the cells. Tab and Shift+Tab move between the columns. Columns marked with * are required.
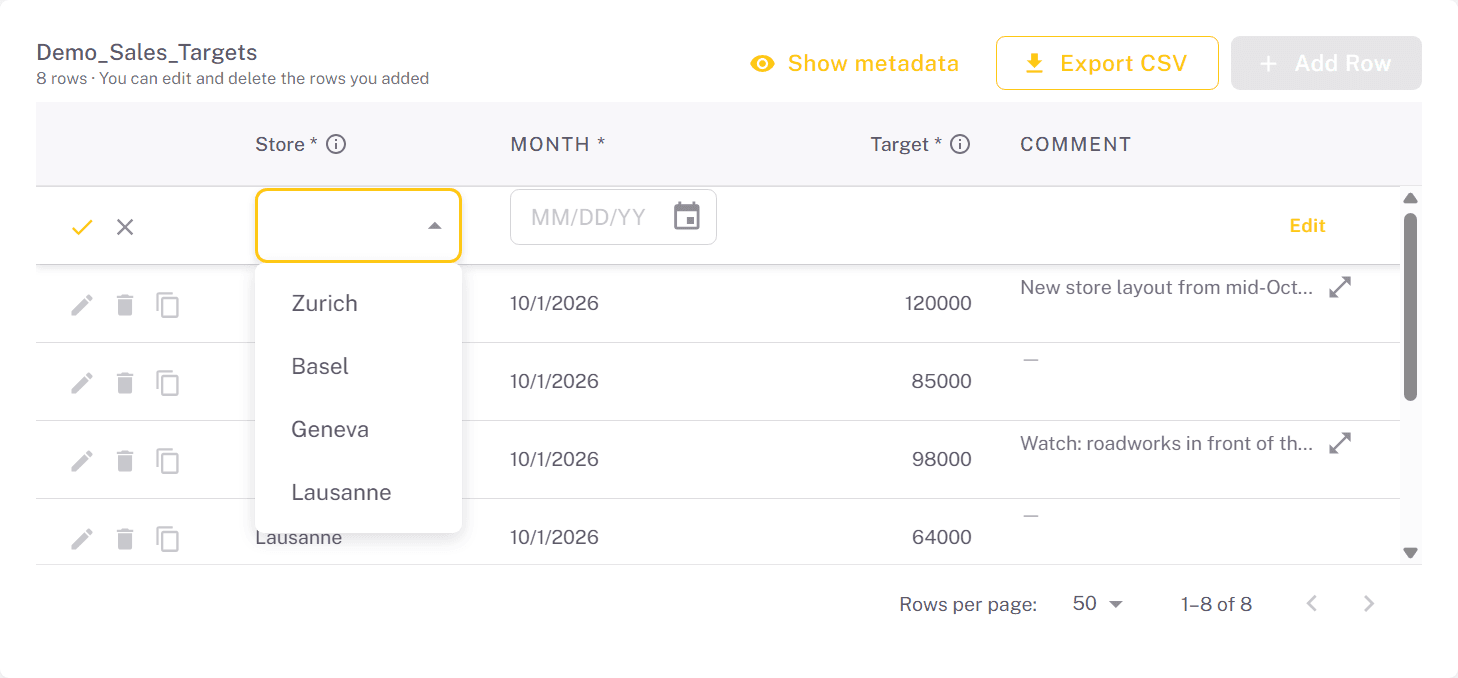
A dropdown column opens its list of values:
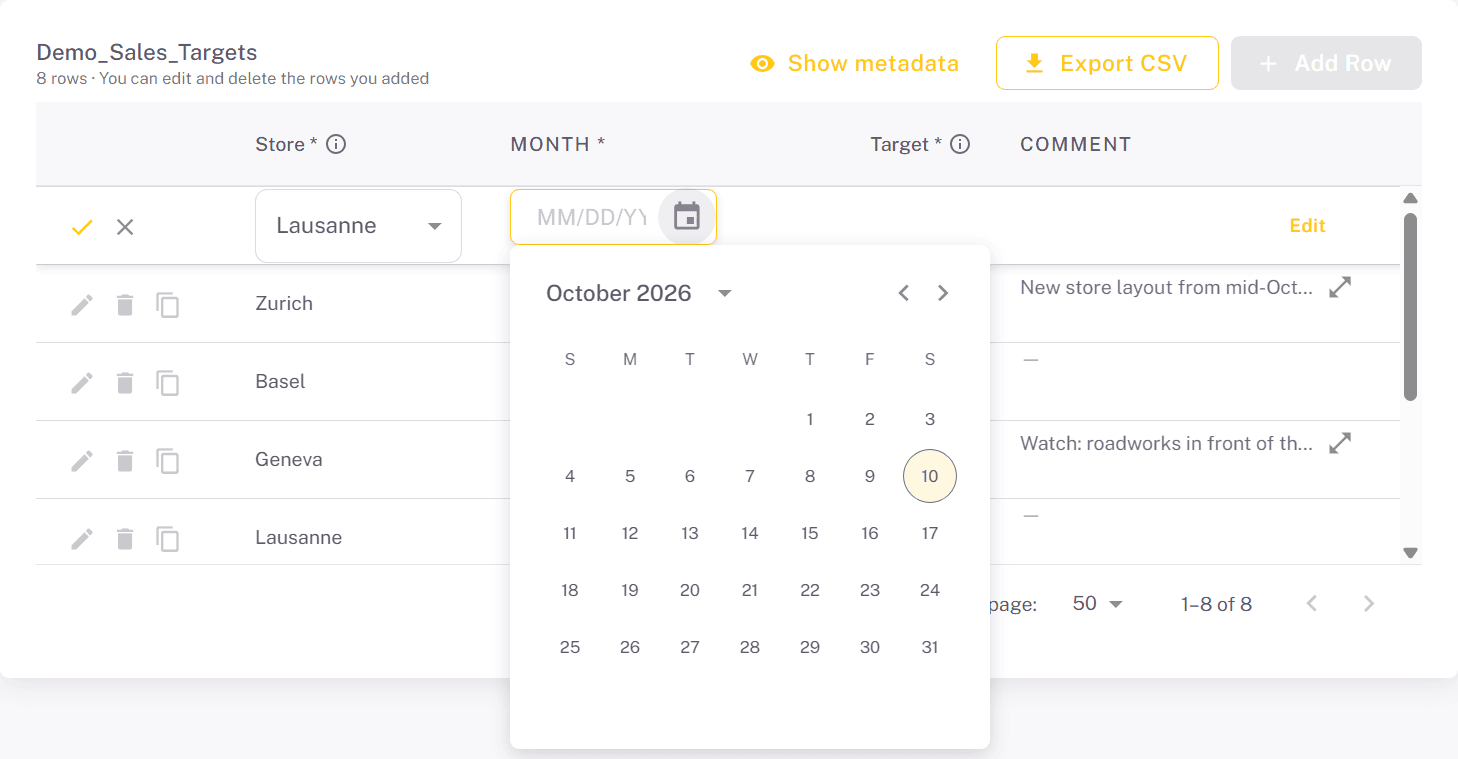
A date column has a calendar, or you type the date:
A rich text column opens an editor, see Formatted text below.
- Click the tick to save the row, or the cross to cancel it.
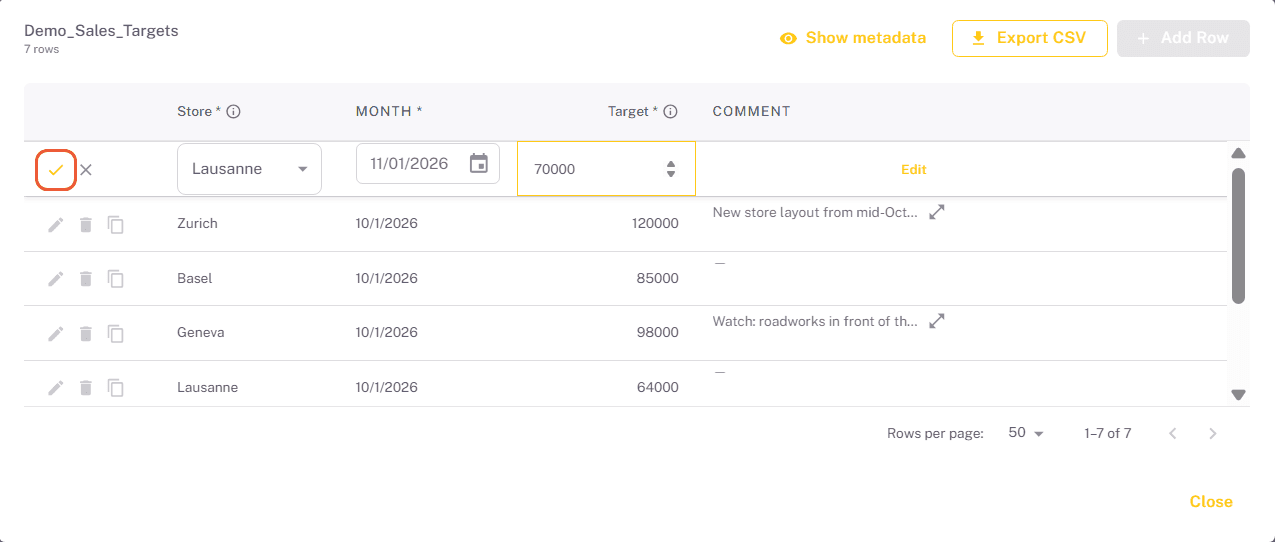
Each existing row has three buttons:
- The pencil opens the row for editing; save it the same way as a new row.
- The bin deletes the row after you confirm. A deleted row can't be recovered.
- The copy icon duplicates the row: a new row opens with the same values, ready to change. Unique columns start empty.
Only one row can be open at a time. Save or cancel it before you page, sort or filter. People who can only edit their own rows see the pencil and bin on those rows only, and people with a view-only level see no buttons at all.
Finding and exporting data:
- Sort, filter, resize and hide columns from the column headers. Clear filters removes the filter.
- Show metadata shows the
idand the Added by, Added, Edited by and Edited columns, which are hidden at first. Hide metadata hides them again. - Export CSV downloads the rows that match the current filter, with the columns currently shown.
- A column with a description shows an info icon in its header; hover over it to read the description.
Formatted text
In a rich text column, click Edit in the cell of an open row. The editor offers bold, italics, lists, colours, links and more. Click OK to put the text in the cell, then save the row with the tick.
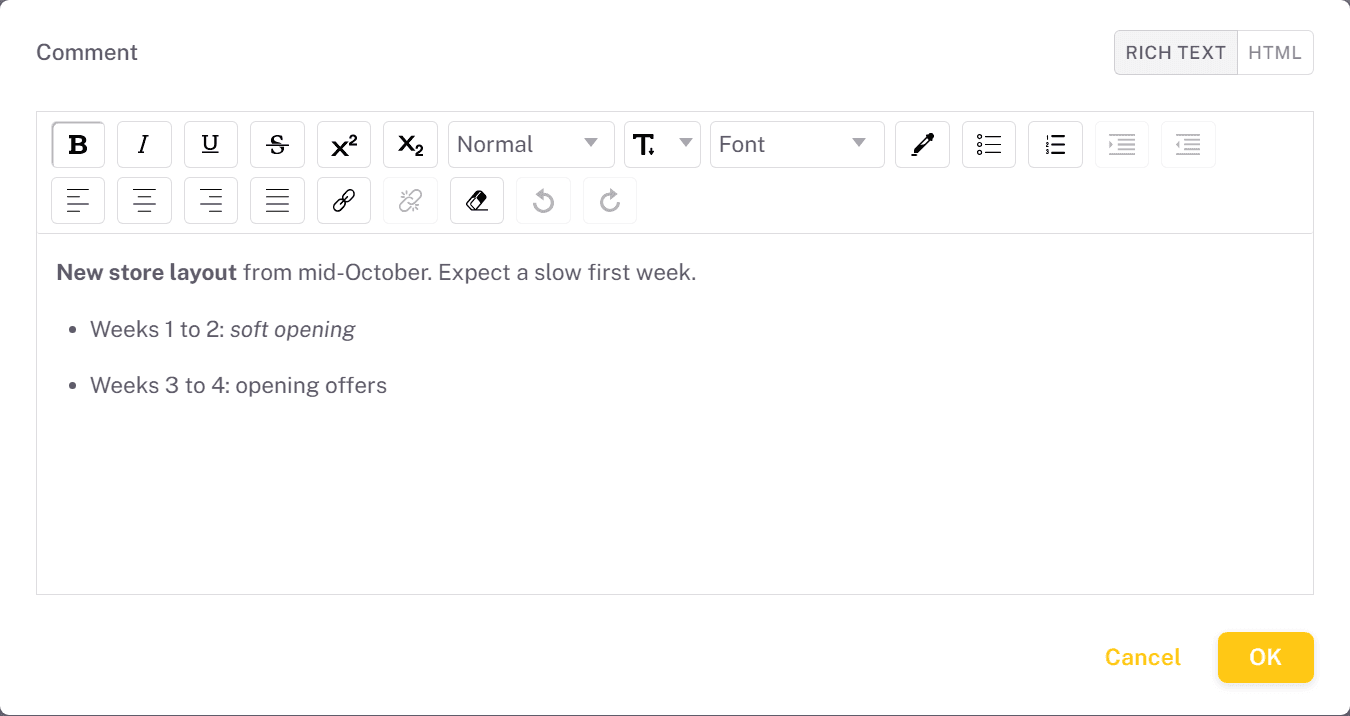
Switch to HTML at the top right to see or edit the HTML itself, for example to paste formatted text from another system:
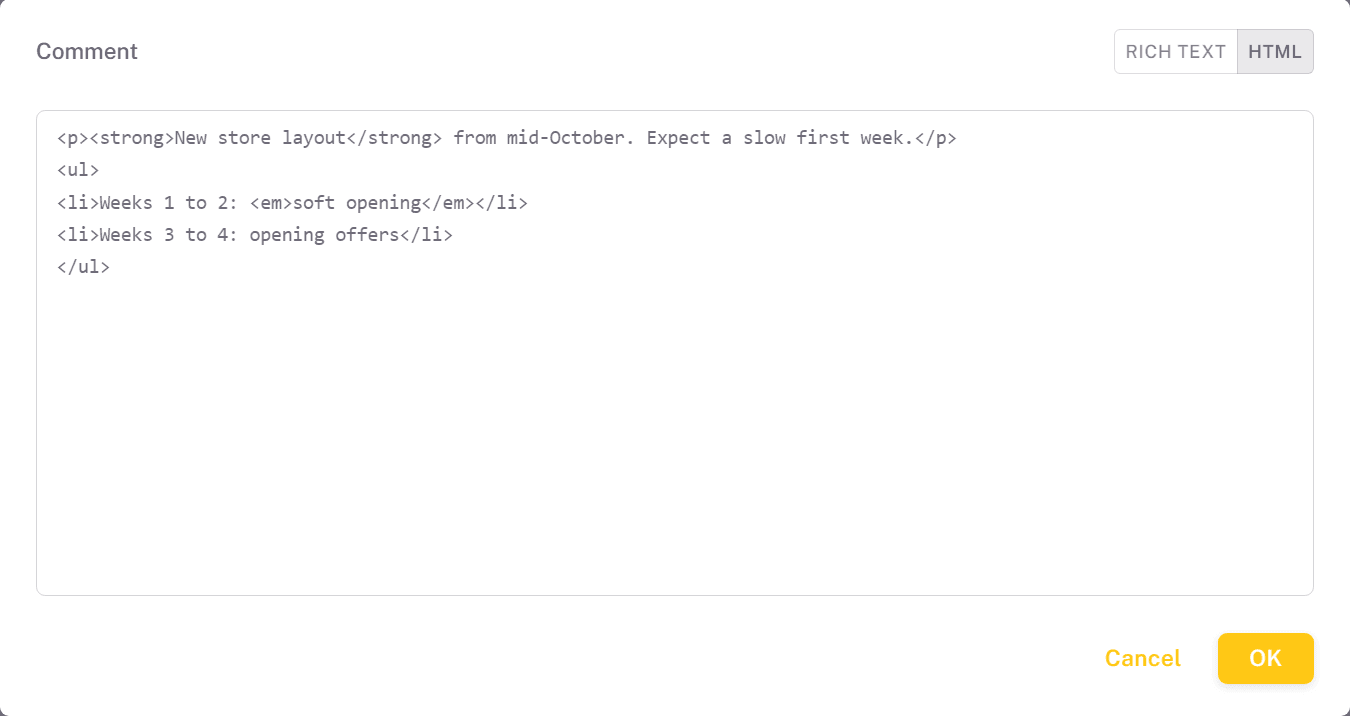
In the grid, the text shows on one line; the expand icon next to it shows it formatted.
Changing or deleting a table
Click Edit Table to change the description or to add, change and remove columns. The table name can't be changed. Nothing changes in the database until you click Update Table.
- Renaming a column keeps its data.
- Changing a column's type: types that would change existing values are greyed out.
- Adding a column to a table that already has rows: the new column must allow empty values at first. Fill it in, then make it required.
- Making a column required is only possible once every row has a value in it.
- Removing a column deletes it with its data when you click Update Table.
Renaming or removing a column breaks the Power BI queries that use it. Their refresh fails until you update the semantic model.
Delete removes the table together with all of its data. The confirmation shows how many rows will be deleted. This can't be undone.
Using the data in Power BI
Power BI reads writeback tables through a read-only user: a database login that the portal creates for you and that can only read the tables you pick. One read-only user can read several tables, so a semantic model that loads several writeback tables needs only one user name and password.
Creating a read-only user
- On the Writeback page, click Read-only Users, then Add Read-only User.
- Enter a Database user name. This is the user name you enter in Power BI.
- Under Tables this user can read, check the tables.
- Click Generate for a strong password.
- Copy the user name and the password with the copy buttons next to them, and click Create User.
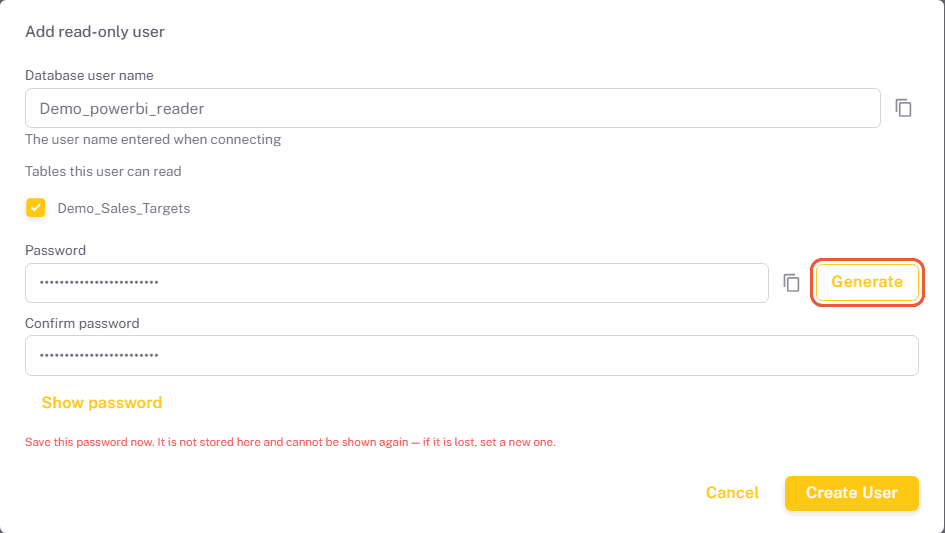
Save the password before you click Create User. The portal doesn't store it and can't show it again. If it is lost, click Set New Password on the user and update the credentials wherever the user is used.
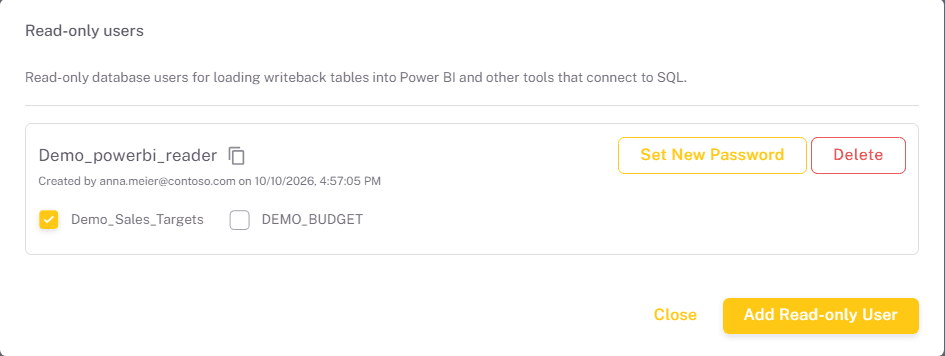
The Read-only users dialog lists every user with who created it and when. Check or uncheck tables on a user and click OK to change what it can read. Delete removes the user, and everything that connects with it stops working.
Connecting Power BI
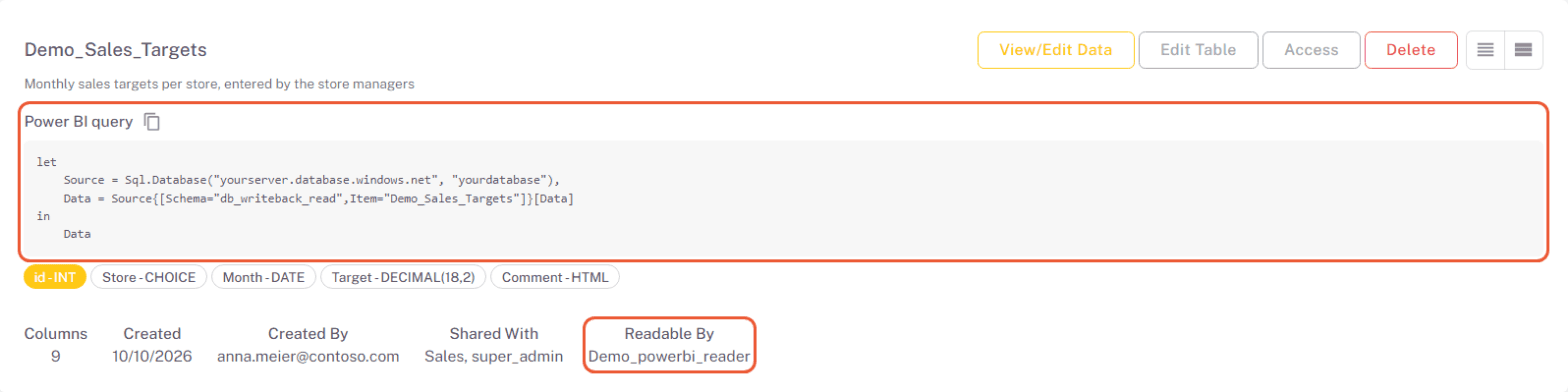
As soon as a read-only user can read a table, the table on the Writeback page shows a ready Power BI query with a copy button, and the user under Readable By.
In Power BI Desktop:
- Choose Get data → Blank query, open the Advanced Editor, and paste the query. Alternatively, choose Azure SQL database, enter the server and database name shown at the top of the Writeback page, and pick the table under
db_writeback_read. - When Power BI asks for credentials, choose Database and enter the read-only user's name and password.
- Load the table and relate it to the rest of your model, for example a budget table to your stores and dates.
- Publish the report and enter the same user name and password as the semantic model's data source credentials. Set up a scheduled refresh, or use DirectQuery for the writeback tables if new entries should appear in the report straight away.
Or directly in the Power BI service, without Power BI Desktop:
- In a workspace, choose Create → Get Data → Blank query, paste the query and click Next.
- Click Configure connection, choose Basic authentication and enter the read-only user's name and password.
- Click Create a report and name the semantic model. New entries arrive with its next refresh.
If the Power BI service can't connect to the database, check its firewall. In the Azure portal, open the SQL server of your Embedsy installation and, under Networking, make sure Allow Azure services and resources to access this server is checked, and save.